
The Alternative Data Edge: Building a Simple Rules-Based Trading System with 2.0 Profit Factor
The Friday Report 90% of Traders Ignore (But Shouldn't)

If you could see whether the biggest hedge funds on the planet were massively long or short crude oil, would you ignore it?
Well…
Every Friday, the U.S. government quietly hands you something close to that.
It doesn't make the front page of Bloomberg…
Most traders scroll right past it…
But inside are the positions of the biggest players in futures markets:
Producers, hedgers, funds, and speculators.
Those who truly move the market.

If you've been following me for a while, then you know what I'm talking about…
The Commitments of Traders report (CoT)
And every single Friday at 3:30 PM EST, the CFTC publishes exactly where these giants are placing their bets.
For free.
Most retail traders don’t even know that it exists.
They're hunting for the "next hot indicator" or chasing some guru's latest revelation on Twitter.
Meanwhile, the smart money is leaving breadcrumbs in plain sight.
Here’s what you’ll walk away with today:
How I read the CoT like a hedge fund (no jargon, just signal).
Where to find CoT-driven trade ideas and turn them into testable setups.
A simple, rules-based CoT strategy on Silver with a +2 Profit Factor (full code included)
The Three Types of Market Players (And Why Only Tracking Two of Them Actually Matters)
I've covered the CoT report in detail before.
If you want the full breakdown (what the three trader groups are, how to build systematic strategies around CoT data, complete backtesting results across multiple markets) check out my previous deep dive on CoT strategies here:

But for those new to this, here's the essential version:
The CoT Report = Institutional Position Data
Every Friday, the CFTC publishes where the big money is positioned in futures markets.
Three groups:
Commercials: The actual businesses. Airlines hedging jet fuel costs. Wheat farmers locking in prices. Oil refiners managing inventory risk. They trade to protect their operations, not to get rich.
Non-Commercials: Hedge funds, money managers, institutional speculators. They trade to profit from price movements. No interest in taking delivery of 1,000 barrels of crude oil.
Small Traders: Everyone else. Retail traders with positions too small to report individually. Historically... not the sharpest knives in the drawer.
Why This Matters
Commercials have inside information. They know supply and demand dynamics months before they hit Bloomberg headlines.
Non-commercials have firepower. When they pile into a trend, they can push prices far beyond what fundamentals alone would suggest.
Small traders? They're usually wrong at extremes.
The Key Insight
Both commercials and non-commercials matter, but for different reasons.
Commercials tell you about fundamentals. Non-commercials tell you about momentum.
When both groups align, you get explosive moves.
When they fight each other, you get tension that eventually snaps.
But Here's the Problem
Raw CoT numbers are useless without context.
"Commercials are net long 50,000 contracts."
Is that bullish? Bearish? How does it compare to their historical positioning?

You have no idea.
That's where sentiment scoring comes in—the system that transforms those meaningless numbers into actionable signals.
And that's exactly what I've automated in my latest strategy approach...
The Sentiment Scoring System That Transforms Useless Numbers Into Trading Signals
Raw CoT data is like having a speedometer that only shows "fast" or "slow."
Technically accurate. Completely useless.
You need context. Historical perspective. A way to know if today's positioning is extreme or just noise.
My Strategy Database
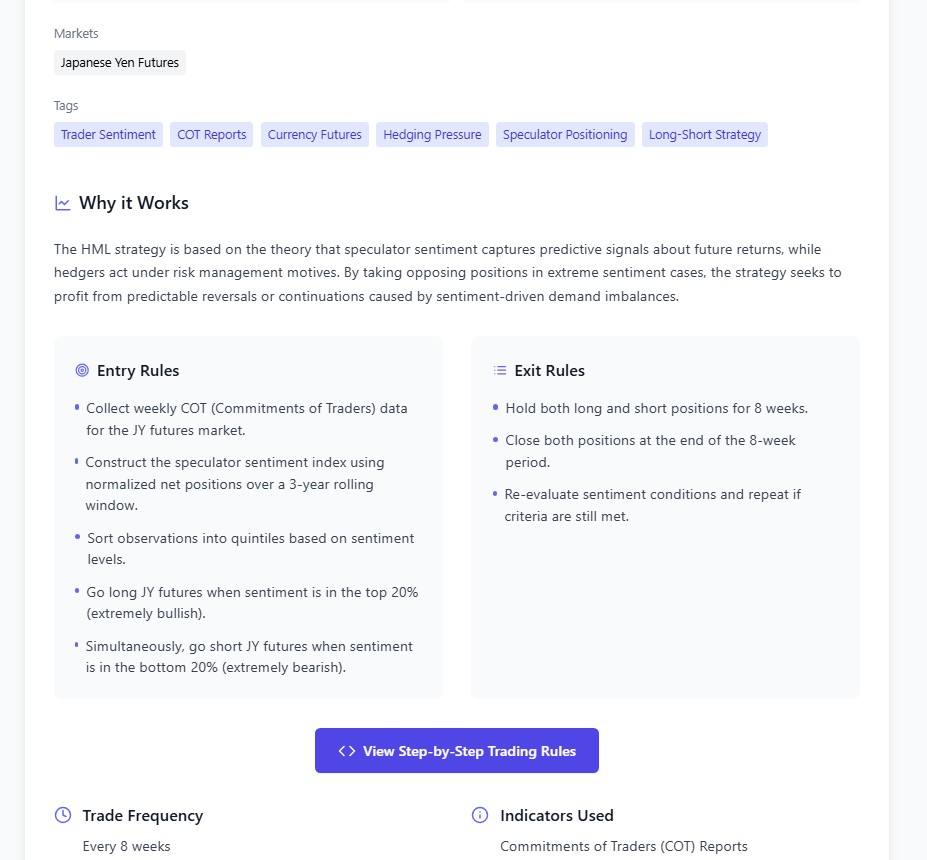
If you're a subscriber, you have access to my strategy database (which I've turned into an app) containing 130+ trading strategies so far, with another 270 to be added by the end of the year.
These strategies come from curated academic papers where I extract the logic into step-by-step processes that are easier to reproduce. Like this:
My idea bank is the first place I go when I need new concepts to test.

I don't try to replicate the papers literally.
Instead, I take the core idea and modify it to fit real-world trading.
And that's exactly what I did with the CoT strategy I'm about to show you.
The inspiration came from "Futures Trading Activity and Predictable Foreign Exchange Movements" by Changyun Wang, published in the Journal of Banking & Finance.
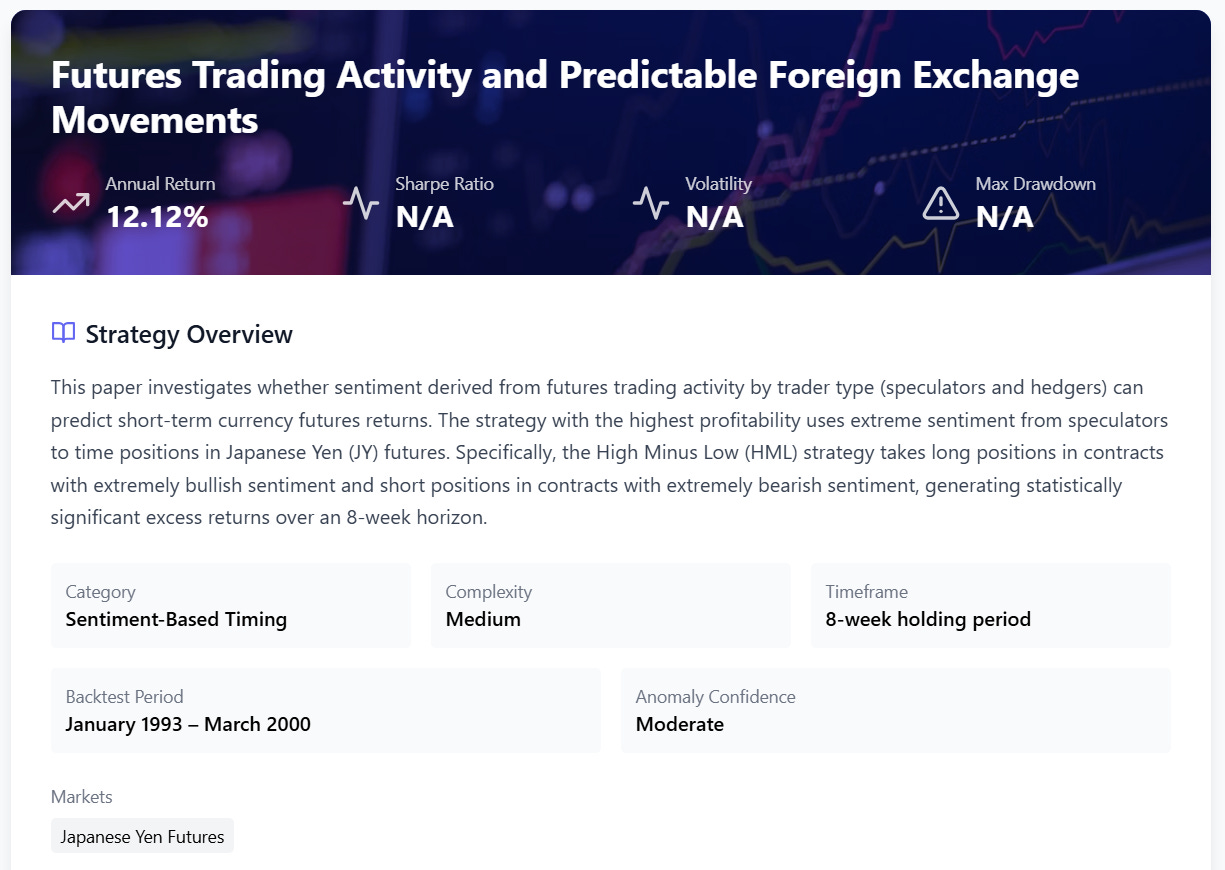
The paper's central insight: create a sentiment index by converting positioning data into sentiment scores using percentile ranking.
The math is simple:
Sentiment Score = (Current Position - Historical Minimum) / (Historical Maximum - Historical Minimum) × 100
This creates a 0-100 scale where:
0 = Most bearish the group has been in the lookback period 100 = Most bullish the group has been in the lookback period
Example…
Let's say commercial traders in Silver are currently net long 15,000 contracts.
Is that bullish or bearish?
You have no clue.
But if their sentiment score is 85, you instantly know they're in the top 15% of their historical bullishness.
That's extremely optimistic territory for the smart money.
If their score is 20, they're in historically pessimistic territory, usually when they're accumulating at attractive prices.
What Wang's Research Revealed
The study tracked five major currency futures markets and found this:
Speculator sentiment was positively correlated with future returns
When hedge funds were bullish, prices tended to rise.
Hedger sentiment was negatively correlated with future returns
When commercials were bullish, prices tended to fall.
In other words: extreme sentiment mattered more than direction.
My Twist on the Strategy
But I didn't implement that exact strategy.
As I mentioned, I use papers as inspiration, not blueprints to copy.
My automated strategy uses this sentiment scoring as the foundation, but my entry logic is different…
Here’s an example of two trades…
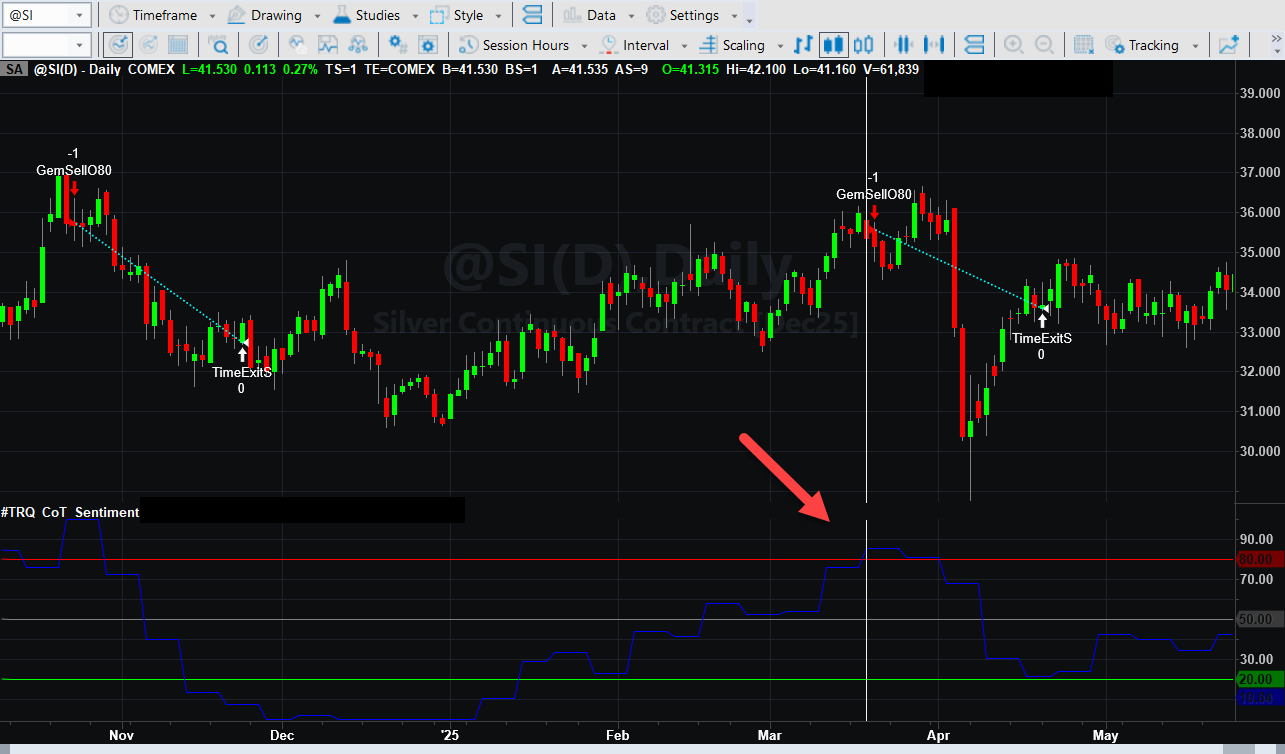
I'll show you the complete approach, including the full code with exact parameters (lookback periods, entry thresholds, exit rules etc).
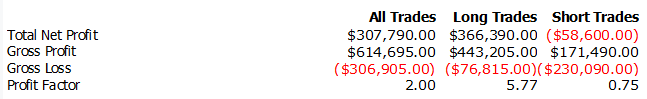
But first, let me show you the preliminary results of this strategy on Silver futures.
Because the numbers tell a story that most traders would kill for...
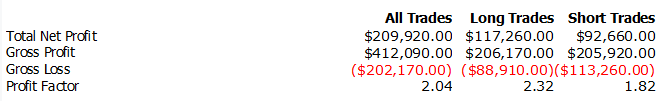
Here are the numbers
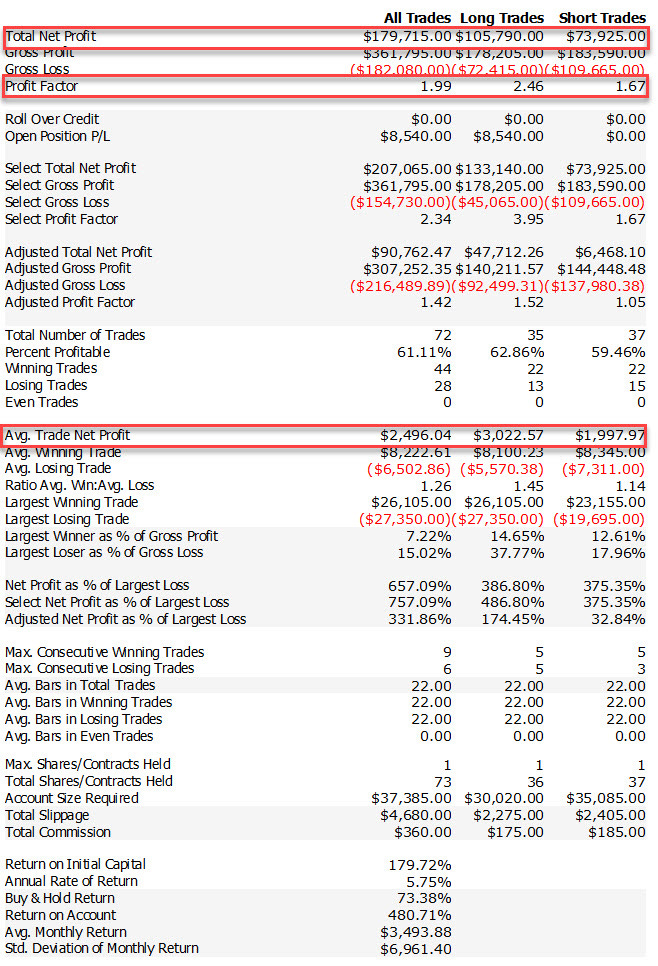
Keep in mind that I didn't optimize the strategy.
Of course, I included commissions and slippage because a proper backtest needs to account for real trading costs.
Here's the equity curve:
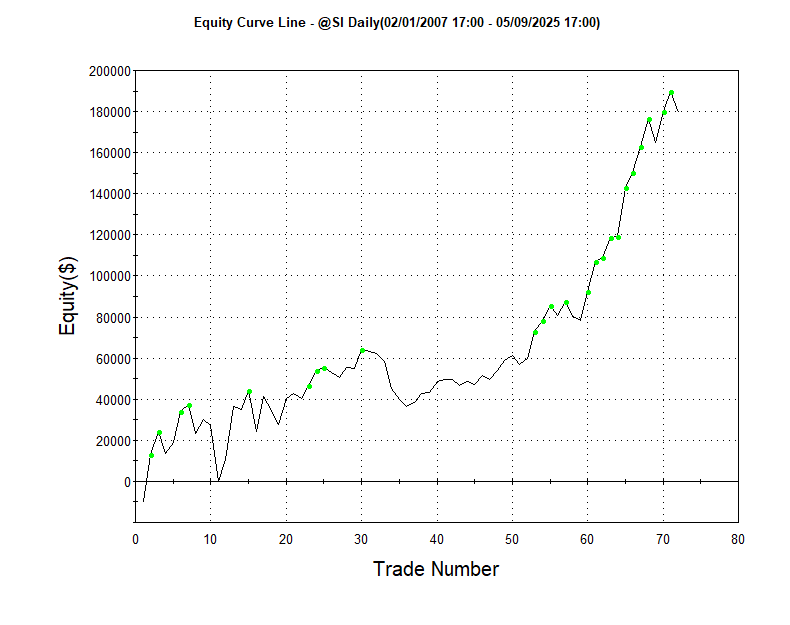
Considering this is a first test with just the sentiment logic and no other rules, I found the results quite solid.
What about other markets?
I quickly tested the strategy on 5 more markets:
• 1 índice
• 1 Meat
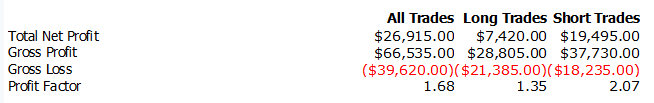
• 1 Soft
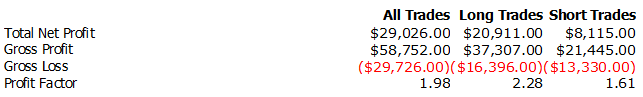
• And 1 Crypto
• 1Agriculture
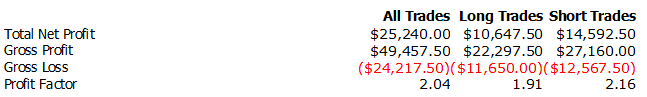

So yeah, it works across several markets…
What Next?
As you've probably noticed, I'm obsessed with CoT data. Mainly because it's based on alternative information.
While 90% of traders are laser-focused on price and volume (and indicators derived from those two variables) I'm adding crucial context to price action:
Positioning
And in financial markets, any additional information can become a robust edge. You just need to know how to use it.
That's why I'm launching something new this month:
The Weekly CoT Intelligence Report
A dedicated weekly report specifically focused on CoT insights.

Every week, I'll break down the most relevant positioning shifts across major commodity and financial markets.
Not just the raw numbers but what they actually mean but…
• Where sentiment has reached historical extremes
• Which institutional players are building massive positions
• When positioning divergences signal potential major moves
• How to interpret the data through the lens of systematic trading
Think of it as your weekly intelligence briefing on where the smart money is positioning.
The CoT strategy you saw today is just one application of institutional positioning data.
There are dozens of ways to extract edge from this information.
Cross-market analysis. Sentiment divergences. Positioning momentum. Seasonal patterns.
The weekly report will explore all of these angles.
The Weekly CoT Intelligence Report launches this month for paid subscribers.
Because the people serious enough to pay for quality analysis are the ones who actually implement these insights instead of just collecting them.
The smart money leaves breadcrumbs every Friday.
Time to start following the trail.

Now the part you were waiting for…