Trading Beyond OHLC: How to Build Strategies Using Alternative Data
How to find trading edges with Commitment of Traders (CoT) report...

Happy Easter!

Every year, my wife and I hide Easter eggs for our kids to find.
Some we leave in pretty obvious spots.
Others… we really put some effort into hiding — just to see how determined they are to find them.
For the harder ones, we usually make a map.
Like a treasure map.
Because, you know…
Parents can get pretty creative sometimes.

It’s funny because the market works the same way.
Some patterns are (kinda) easy to spot like classic momentum plays that everyone knows.
But others are hidden in places most traders don’t usually look...
Not just in price data (OHLC) or volume.
As an algo trader, you should start with the simple stuff.
But whenever possible, you should also hunt for edges in the less obvious places.
And that’s exactly where the CoT report comes in...
(btw there is no complexity here).

1. What is the CoT Report, Anyway?
Imagine if you could peek behind the curtain and see what the biggest players in the market are doing.
That’s basically what the Commitment of Traders (CoT) Report gives you.
Every week, the U.S. Commodity Futures Trading Commission (CFTC) publishes a detailed breakdown showing how different types of traders are positioned in futures markets.
There are two main reports: the Disaggregated and the Legacy report. In this post, we’re going to focus on the Legacy CoT Report.
There are three main groups of players:
Commercials: These are the real businesses — farmers, airlines, energy companies — that use futures to hedge their operations.
Non-Commercials: The big speculators — hedge funds, managed money, institutional traders — who are trying to profit from price movements.
Non-Reportable: The "small fish" — traders with positions too small to be individually reported.
The CoT report tells you how many contracts each group holds long (betting prices will rise) and short (betting prices will fall).
If you head over to the CFTC website and click on the Legacy CoT Report, you’ll see something like this:
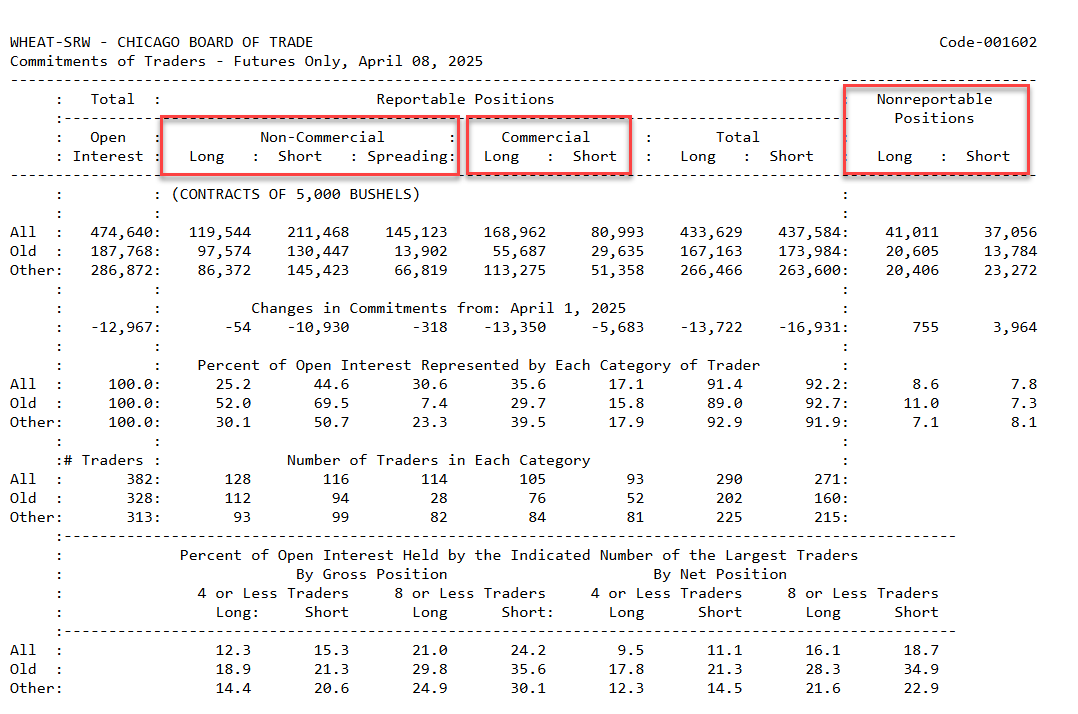

But don’t worry.
I’m going to walk you through exactly what all those numbers mean.
But first, here’s the important part most traders miss:
While prices move every day based on emotion, news, and noise…
the CoT shows you where the real weight of money is quietly accumulating.
It’s like seeing the ocean currents underneath the waves.
And if you know how to read those currents?
You can find trading edges that don’t show up on any price chart.
The Obvious (and Not-So-Obvious) Questions About CoT Reports
Once you understand what the CoT report measures, you quickly realize something:
There’s a lot of data inside those tables.
Commercials. Non-Commercials. Spreading. Changes from last week. Percent of open interest. Number of traders.
It’s overwhelming at first.

And that leads to the same set of questions every trader eventually asks:
Which group should I actually pay attention to?
Is it better to follow the Commercials… or fade the Non-Commercials?
Does it matter if their positioning changed from the previous week?
Should I look at absolute numbers... or percentages?
How extreme does the positioning need to be to matter?
How long should I hold a trade once I act on a signal?
Is CoT data enough by itself or should it be filtered by price action too?

See the problem?
Too many moving parts.
But today I’m going to show you something different.
Something simple. Systematic. Testable.
So I set out to build a CoT strategy with 3 rules:
No predicting. Only reacting to extreme trader behavior.
No curve-fitting. One version that works across multiple markets.
No black-box magic. Full transparency from day one.
Here’s what I came up with 👇
How I Built the Strategy
Ok, now that you understand the context and what the CoT report is really about (who’s betting long, who’s betting short, and how those bets are shifting week after week)…
The next step is turning all that theory into something tradable.
In other words, it’s time to build a testable hypothesis.
To do that, I pulled a simple idea from the excellent book The Commitments of Traders Bible by Stephen Briese.
Here’s the blueprint I’ve followed:
This strategy uses Commitments of Traders (CoT) data to identify potential market turning points based on the positioning of commercial and non-commercial traders.
It calculates the net position (long minus short) for each group and evaluates the current value against the past x number of weeks using a percentile rank.

A long (buy) signal is generated when commercial traders are in the top percentile of net long exposure and increasing their position, or when non-commercials are heavily net short and increasing their short exposure which is interpreted as a contrarian bullish sign.
On the other hand, a short (sell) signal is generated when commercials are heavily net short and increasing shorts, or when non-commercials are aggressively net long.
Trades are entered once per week on a particular day, and positions are exited after a fixed number of bars or when an opposite signal appears, ensuring both signal strength and disciplined trade management.
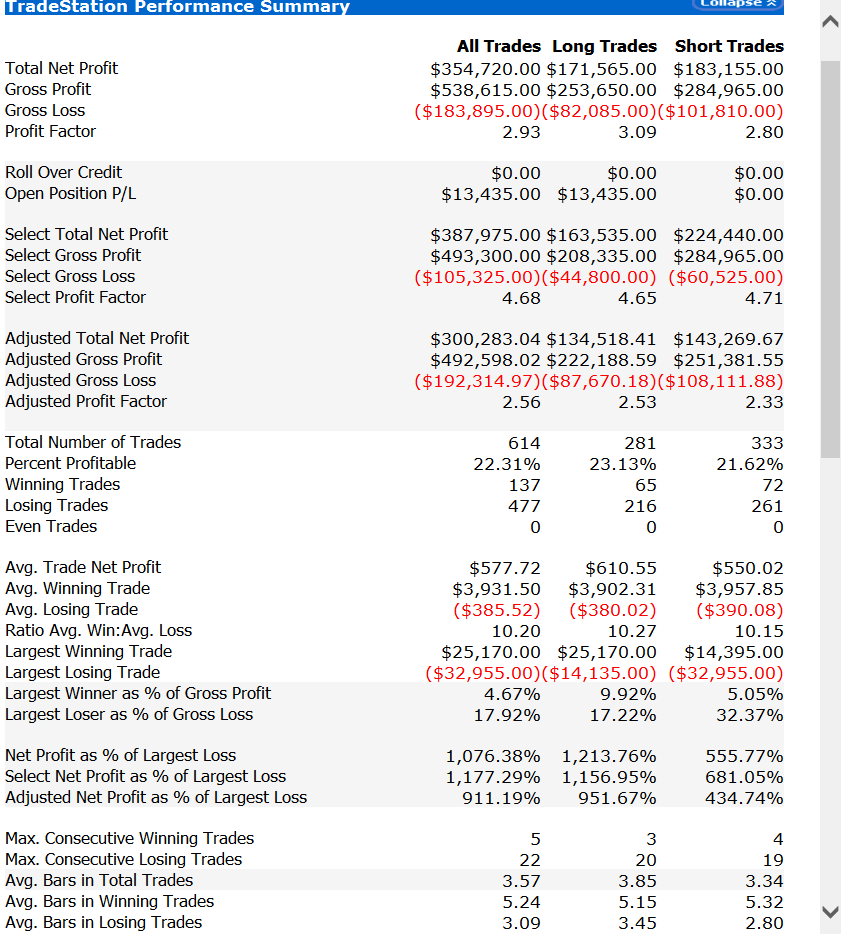
Here’s some preliminary results:

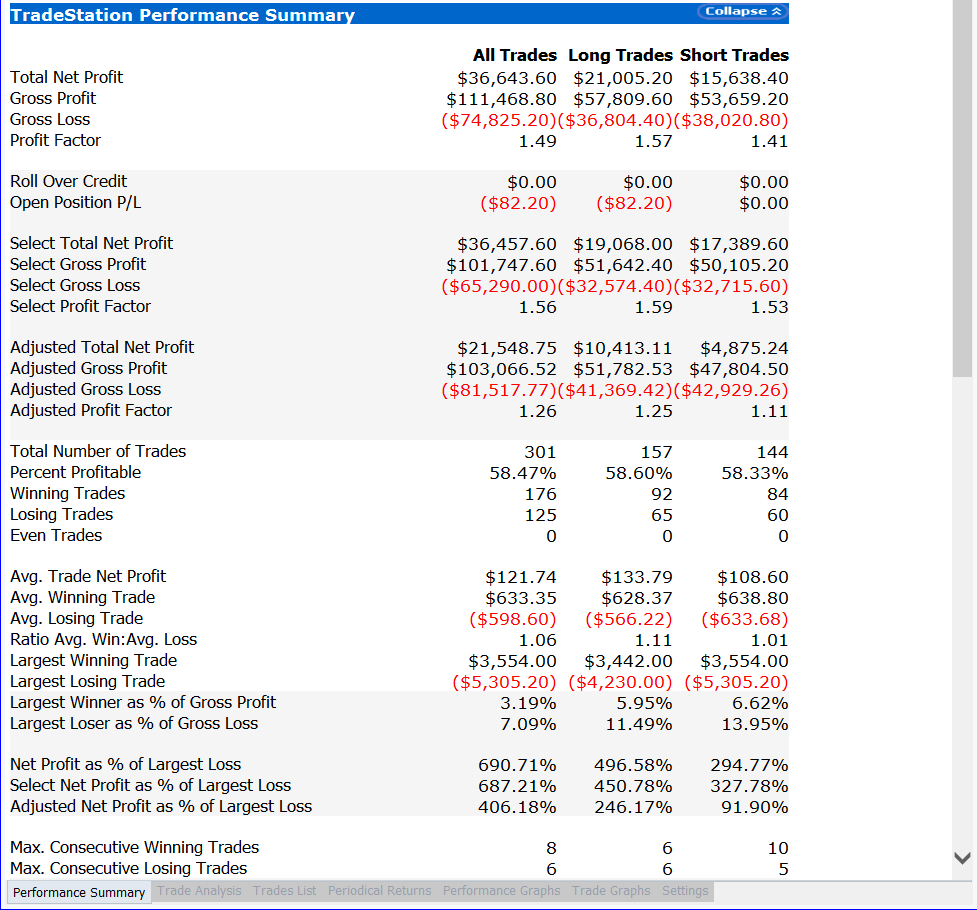
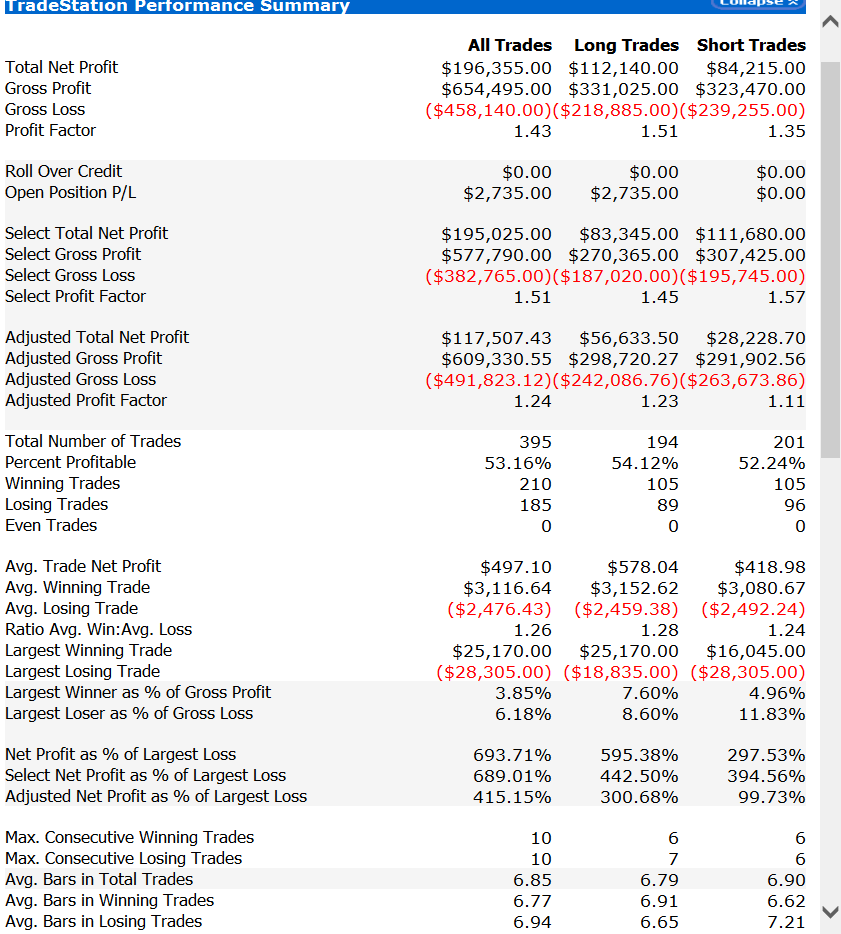
These are the results for 3 different assets.
You might not find them mind-blowing at first glance, but keep this in mind:
This is the exact same strategy applied across multiple markets without tweaking a single parameter or doing any kind of optimization.
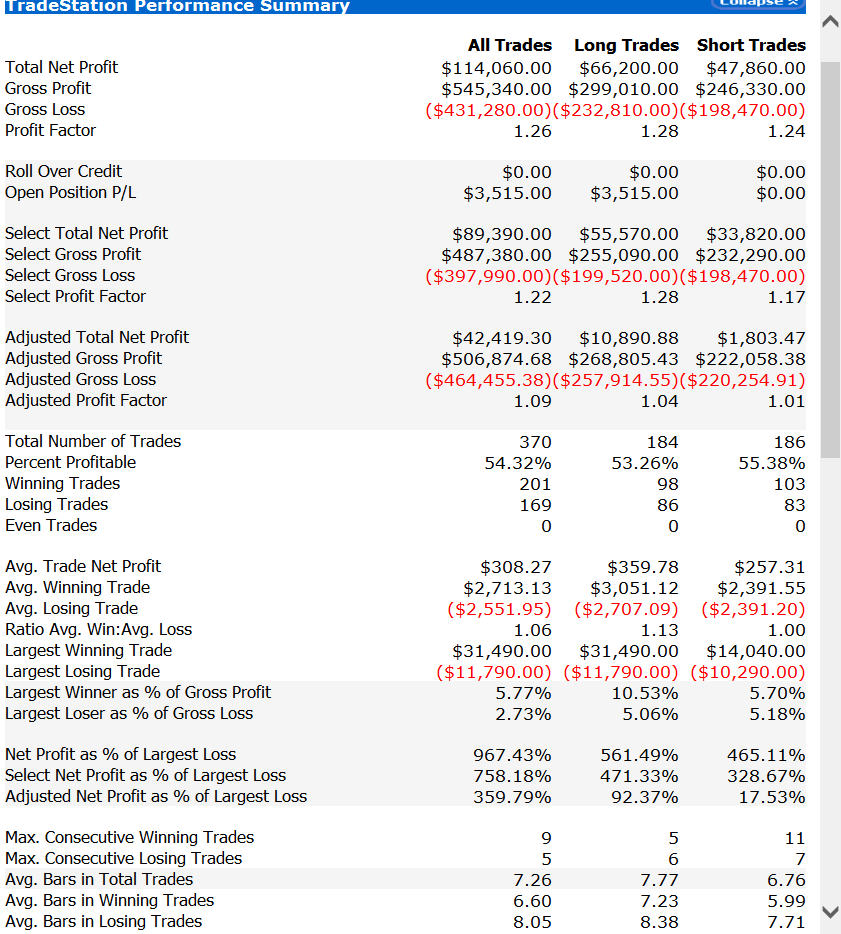
Talking about optimizations…
With just a simple tweak to one parameter (the stop loss), I found this:

So yeah, there are tons of ideas to explore with the CoT.
Now let’s dive into the actual rules of the strategy and the full code behind it.
Shall we?