Research Is Just the Start: How I Turn Ideas Into Strategies
And how to improve your code with a simple AI prompt

Last week, I shared with you how to extract trading logic from academic papers using LLMs.
If you missed it, here’s the post:

I walked you through the actual process I used to decode the logic behind the “Same-Weekday Momentum” paper and shared with you the exact prompt I used to do so.
But that was just the first half of the equation.
That post was about how to get an idea.
This one is about what happens when you actually run with it.
I’m going to show you how I implemented the “Same-Weekday Momentum” strategy
…but with a twist.
Instead of applying it to equities like the original paper,
I adapted the logic to futures.
I used AI to speed things up, validate ideas, and make the process less painful and yes, it’s something you can totally steal for your own workflow.

Let’s get into it.
The Paper in One Paragraph
The paper is called “Same-Weekday Momentum” by Zhi Da and Xiao Zhang.
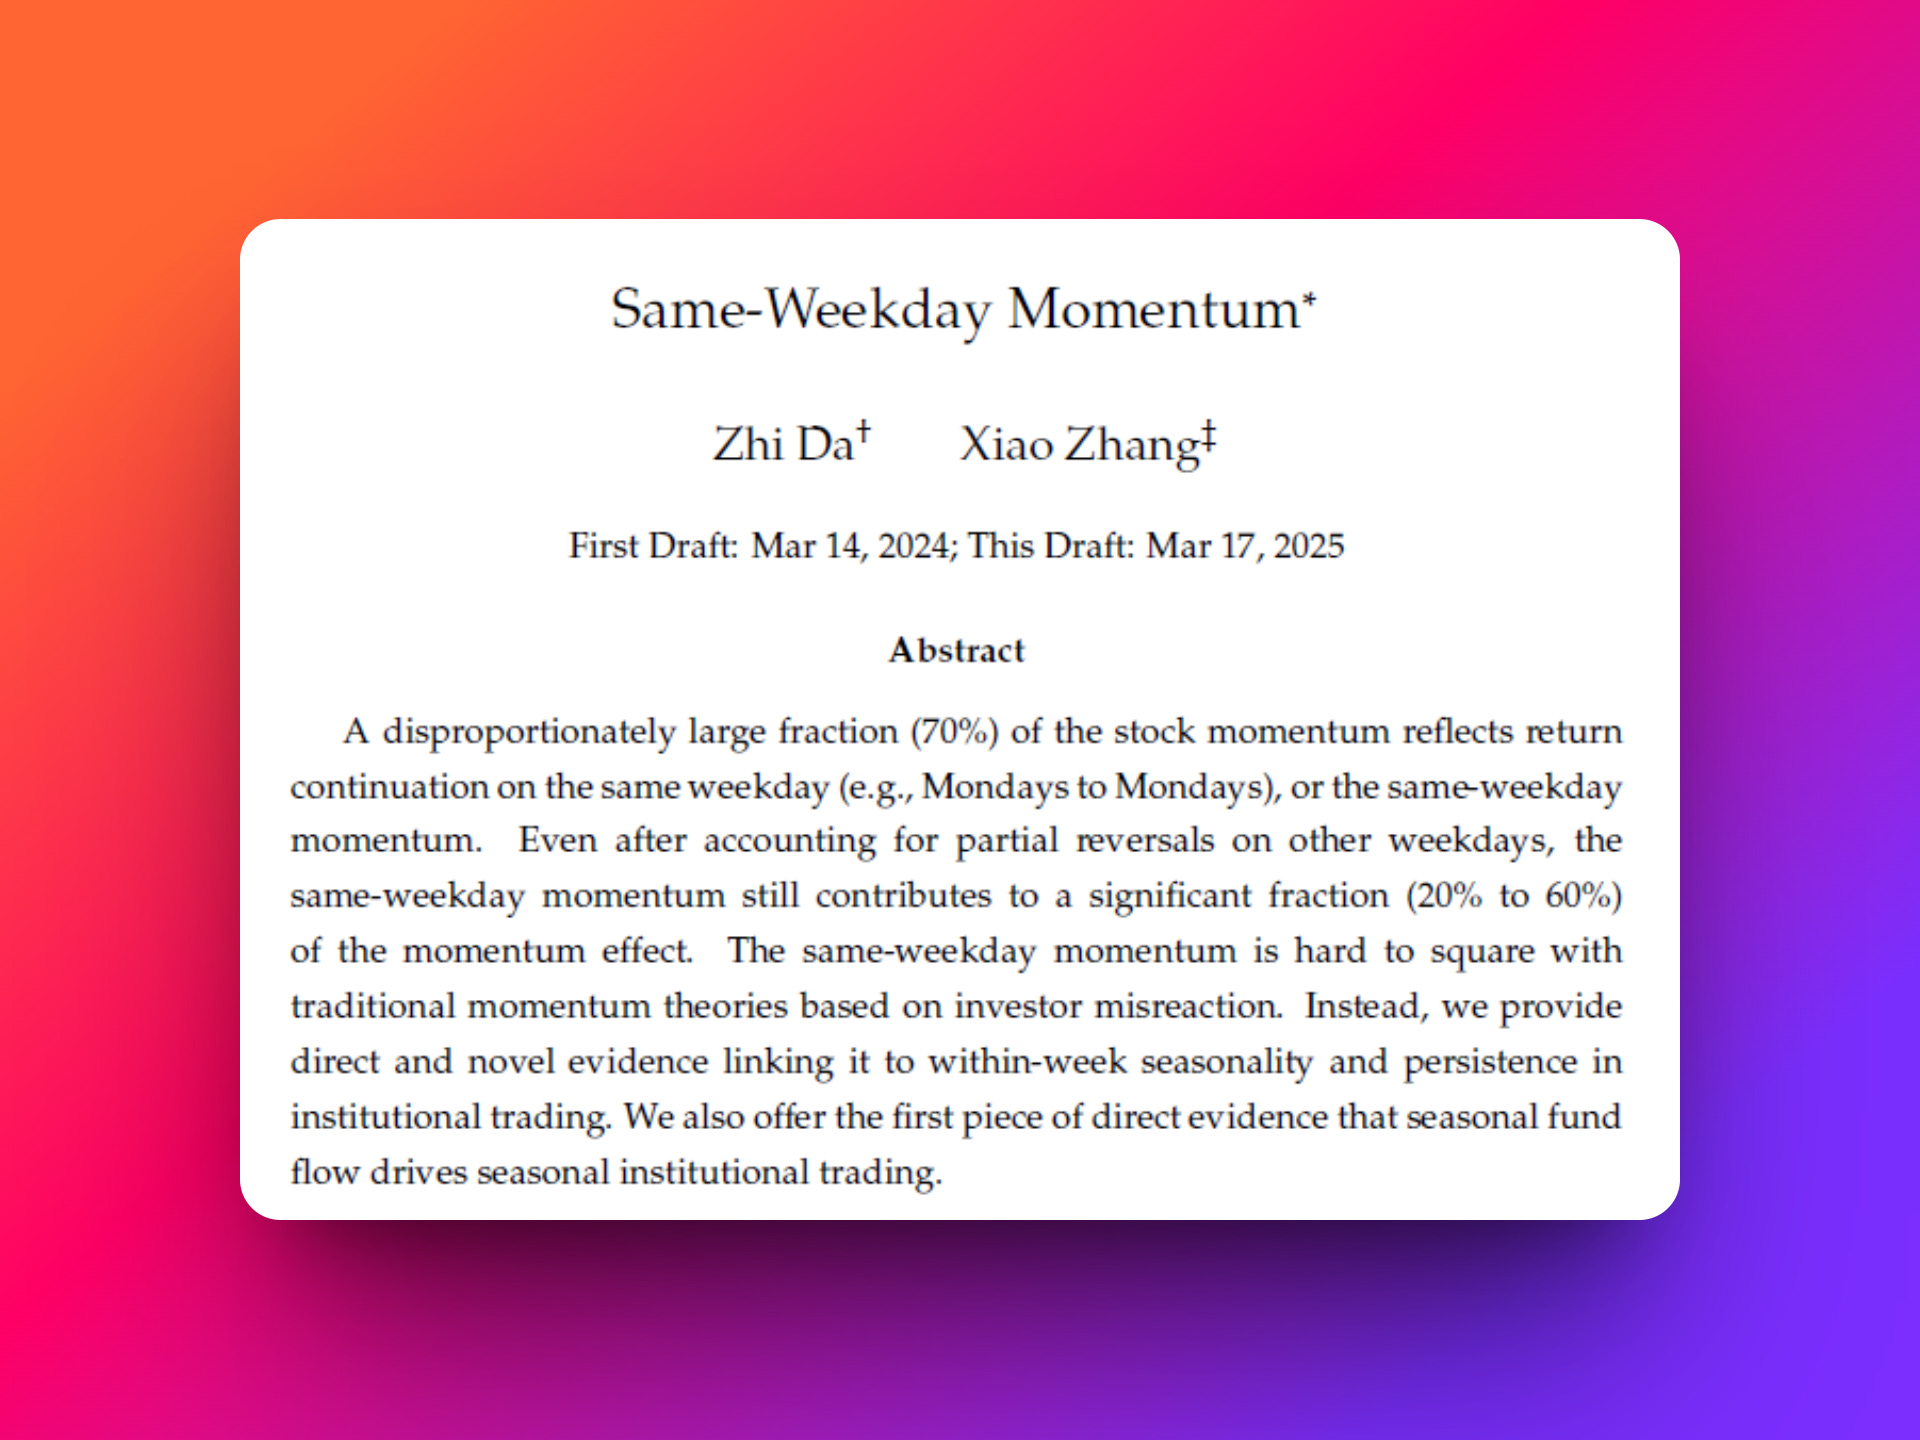
The core idea is dead simple:
Assets tend to show momentum on the same weekday across time.
So if a stock tends to perform well on Wednesdays, there’s a good chance it will keep doing well on future Wednesdays.
The trading strategy in a nutshell:
Each trading day, you:
Identify the day of the week (e.g., Wednesday)
Look back over the past 11 months (but only consider the specific weekday , in our example: Wednesdays)
Skip the most recent month (to avoid mean reversion bias)
Calculate the average Wednesday return for each stock
Sort stocks into deciles based on those average returns.
The Execution
Go long the top 10% of stocks with the strongest average return on that weekday.
Go short the bottom 10% with the weakest.
Rebalance daily based on the new weekday.
Exit positions at EOD
Filters Applied
Ignore stocks trading under $5.
Remove the bottom 10% by market cap.
Update filters monthly.
The Edge Hypothesis
The authors suggest this is a reflection of institutional behavior.
Big funds often trade in repeatable patterns (weekly flows, recurring meetings, etc), and this creates persistent rhythms.
Great, but what if I don’t want to trade 1000 stocks?
What if I prefer futures?

The Twist: My Version for Futures
I’ve said this countless times:
I use academic papers as inspiration, not as ready-to-deploy systems.
The paper was solid. The logic was sound.
But I just wanted to see if the core idea held up in futures.
This is how I end up creating unique strategies without fearing edge decay.
Take a core idea.
Adapt it to your market, your timeframe, your exit logic, your constraints.
That alone increases your odds of success.
And the more “Frankenstein-style” strategies you stack in your portfolio, the better your long-term edge.
Now here’s where my process kicks in:
Instead of writing all the code from scratch, I use AI to help me adapt the logic for the specific assets I trade.
In fact, in last Thursday’s post, I shared two prompts:
One that extracts logic from academic papers
Another that adapts the logic to your market, timeframe, and constraints
And that second one? That’s the one that gave me the idea to test this strategy in futures.
From Paper to Python (with AI Help)
Here’s where most traders get stuck.
They read a paper, they like the idea…
But when it’s time to code and backtest the thing? Total paralysis.
The gap between "interesting concept" and "working code" feels massive.
That's where AI changes everything.
And I’m going to share a simple hack that helps me a lot when it’s time to write code…
Whether you’re starting from scratch or already have a rough first version.
I ask one LLM to review the other’s code.
In this case, I’m sharing the code written by ChatGPT with Claude:
I asked ChatGPT to code in Python the "Same Weekday Effect" strategy. The same strategy you just coded for me.

I shared the same assumptions and dataset.

Now I want you to review ChatGPT's code and point out the main differences compared to yours, any conceptual mistakes, execution flaws, and why you believe those are issues.

Be extremely thorough—but also humble enough to acknowledge any possible mistakes or oversights on your end.

Because that’s exactly how ChatGPT reviewed your code: critical and honest. (I’ll tell you everything ChatGPT said about your code later)

Here's the code
[CODE]
Instead of spending days debugging Python errors, I got two AIs to compete for the best implementation.
The downside? You’ll need to use two different LLMs.
The upside? You’ll catch potential errors 10x faster.
In 15 minutes, I had something testable.
And that’s all I needed.
If you’re a paid subscriber, I dropped the full code below (and added comments so you can play with it too).
If you’re not… now’s a pretty good time to become one :)
Next, I’ll walk you through what I tested and the results I got…
What I Tested
I took the core logic from the “Same-Weekday Momentum” paper and adapted it to futures.
The only real change?
I swapped out the assets.
Instead of testing stocks, I ran the strategy across a basket of futures contracts.
A 7-step process to backtest fast
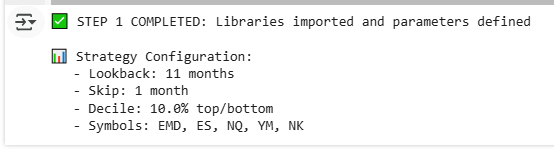
STEP 1: INITIAL SETUP
Here’s the full universe I tested:
#Indexes = ['EMD', 'ES', 'NQ', 'YM', 'NK', 'VIX']
#Currencies = ['AD', 'BP', 'CS', 'DX', 'EC', 'JY', 'MP1', 'SF']
#Energies = ['CL', 'HO', 'NG', 'RB']
#Metals = ['GC', 'HG', 'PL', 'SI']
#Softs = ['BO', 'C', 'KC', 'O', 'RR', 'SB', 'W']
#Interest Rates = ['FV', 'TU', 'TY', 'US']
First, I tested the entire basket of assets using the long/short strategy, and the result didn’t beat the S&P 500 buy and hold.
So I started testing long/short by asset class: indexes, currencies…
First insight?
It completely flopped on currencies, energies, metals, and softs.
Decent for interest rates and indexes.
So I made a simple adjustment:
Instead of the long/short strategy…
I ran it long-only within each asset class… one at a time.
First just metals.
Then just energies.
Then just indexes.
You know where this is going…
And since everyone knows index futures have a natural long bias.
That was my first focused test:
long-only on stock indexes.
And that’s where things started to click…
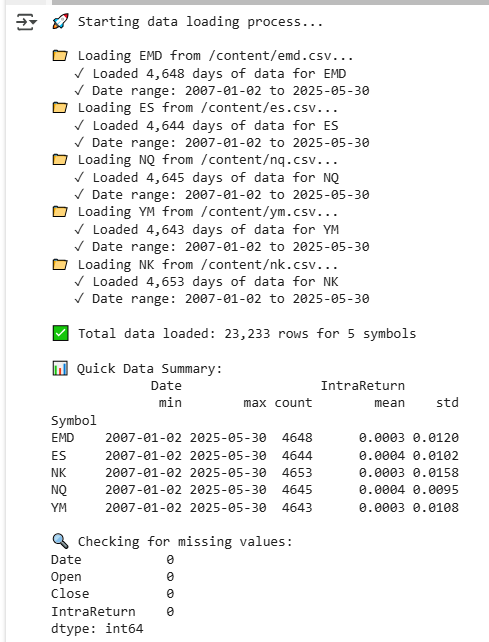
STEP 2: LOAD AND PREPARE DATA
The sanity check on the data…
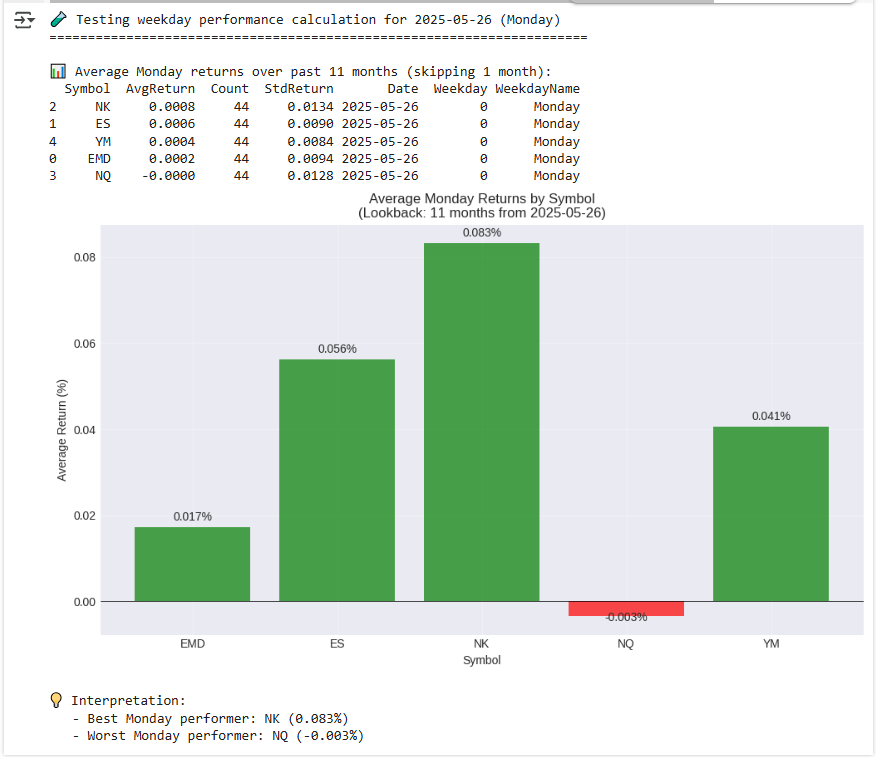
STEP 3: CALCULATE WEEKDAY PERFORMANCE RANKINGS
This was the heart of the strategy: for each date, we calculate which symbols performed best on that specific weekday historically
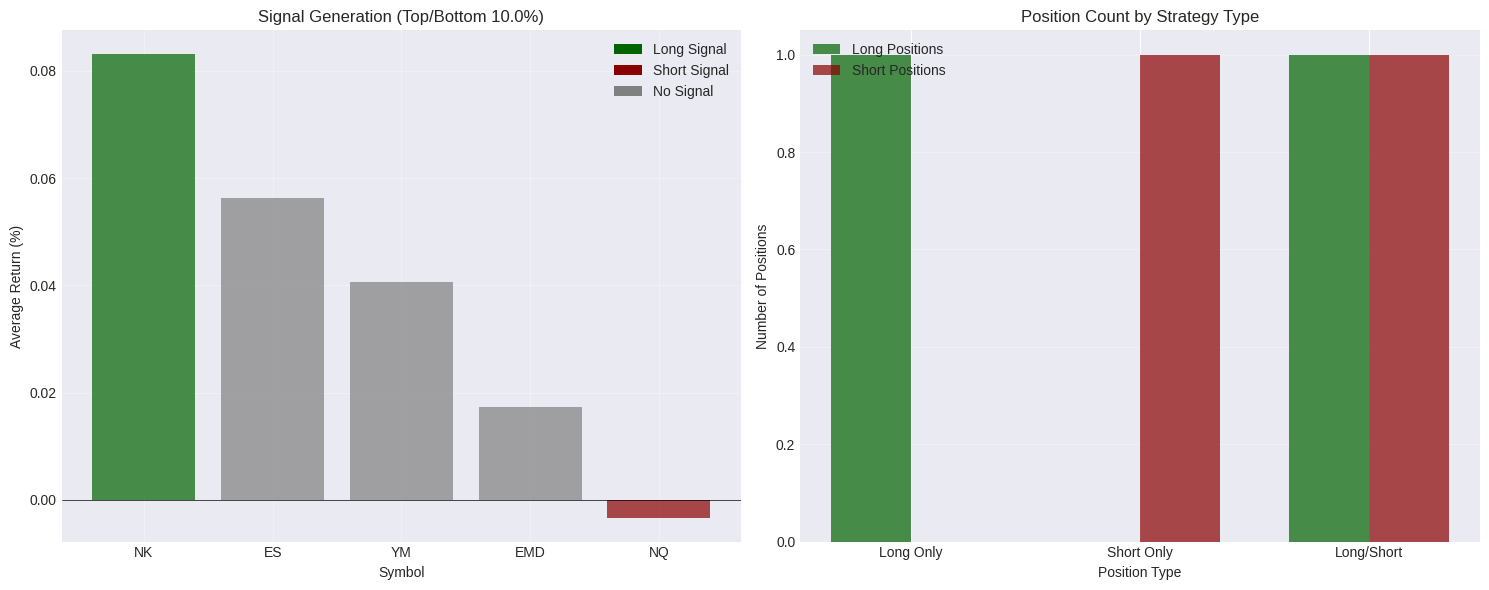
STEP 4: GENERATE TRADING SIGNALS
Based on the rankings, determine which symbols to trade each day and I wrote the code to choose between 'long', 'short', or 'both'
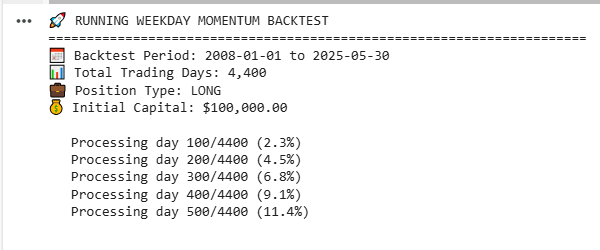
STEP 5: BACKTEST ENGINE
This is the most exciting part. Show me the (historical) money part :)
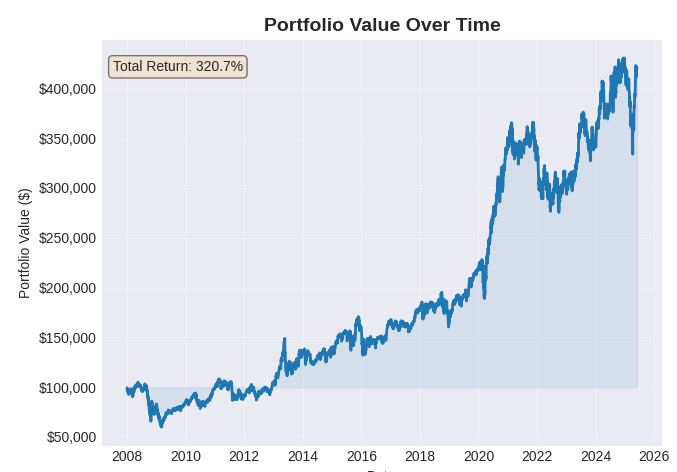
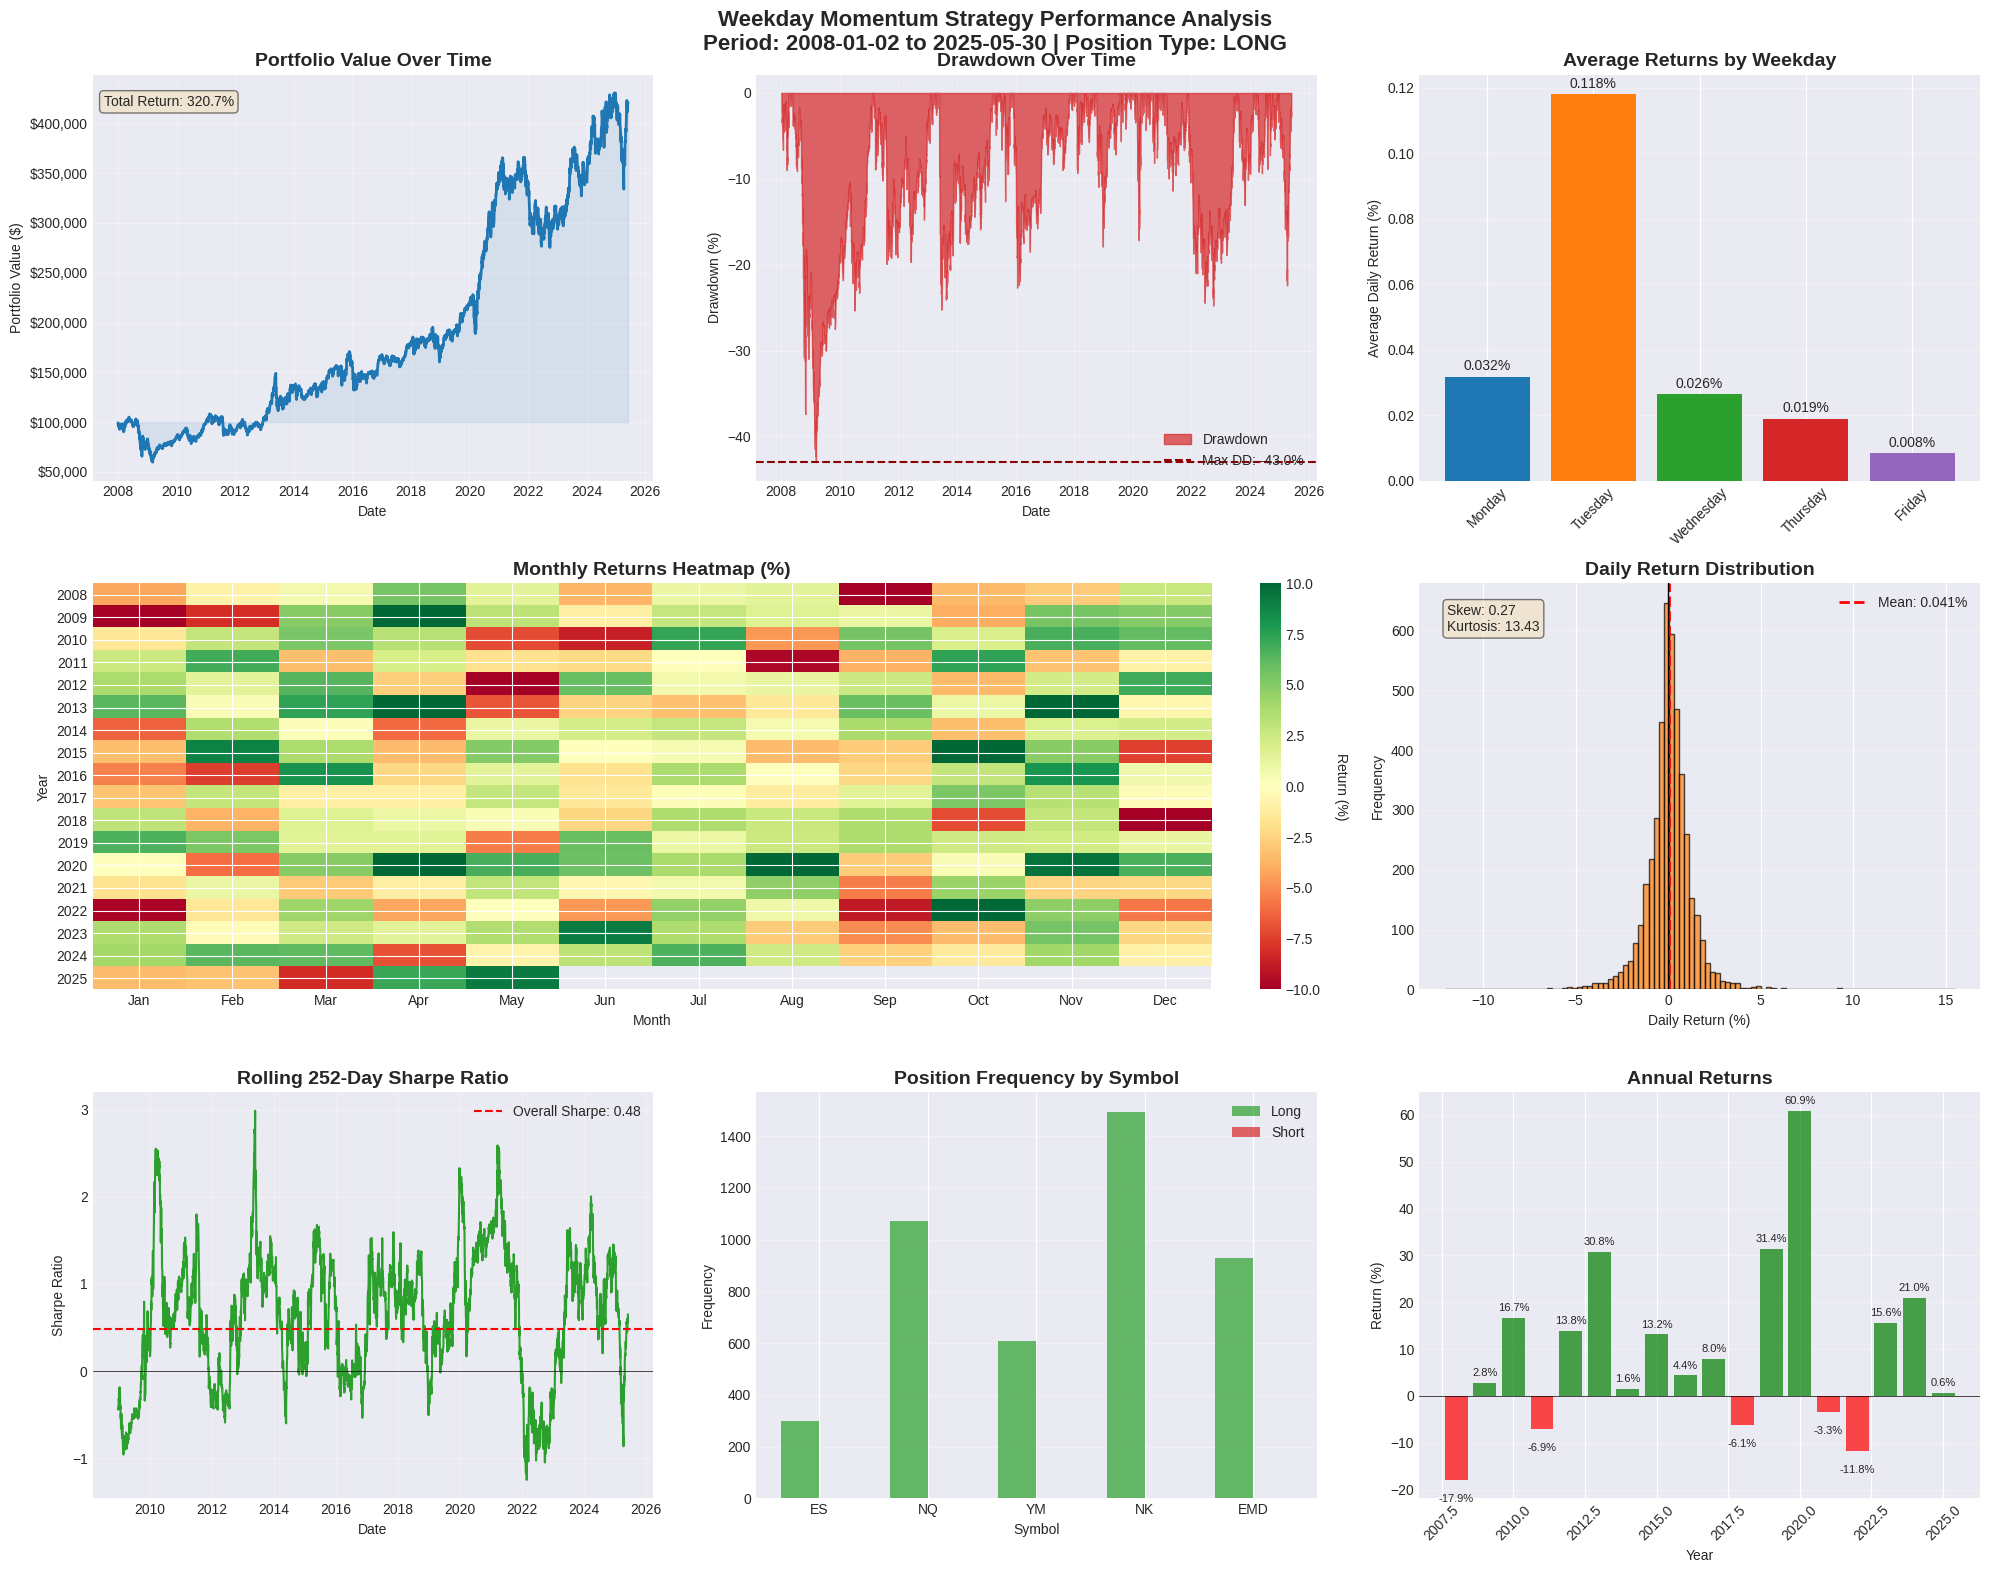
At the end we have a final result like this…

320% return, beating the S&P 500 during the same period with a better Sharpe Ratio…
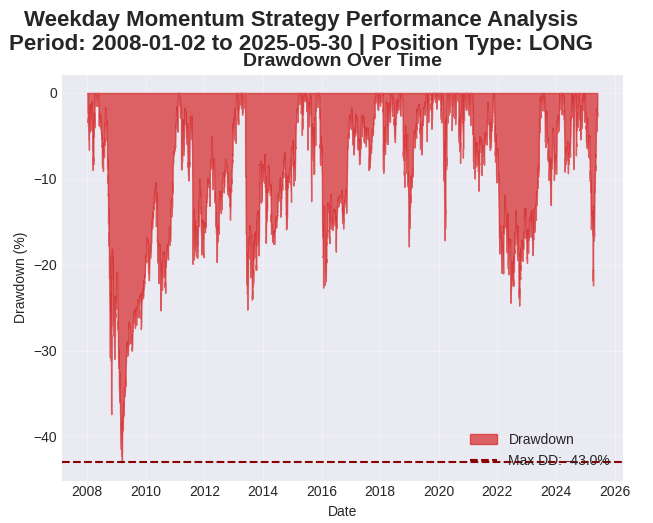
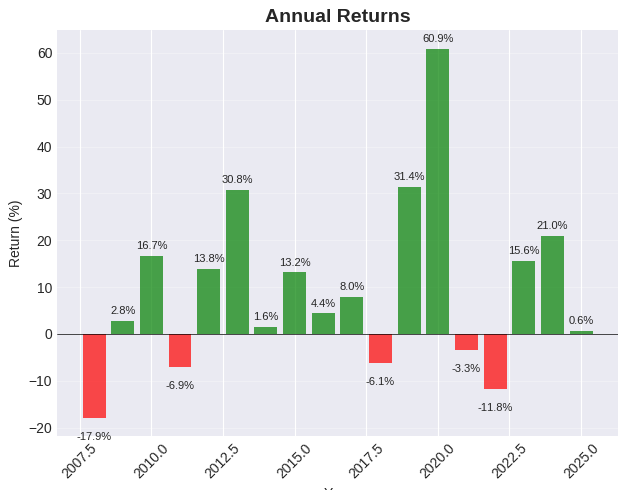
STEP 6: COMPREHENSIVE PERFORMANCE METRICS
A more detailed analysis about key metrics…
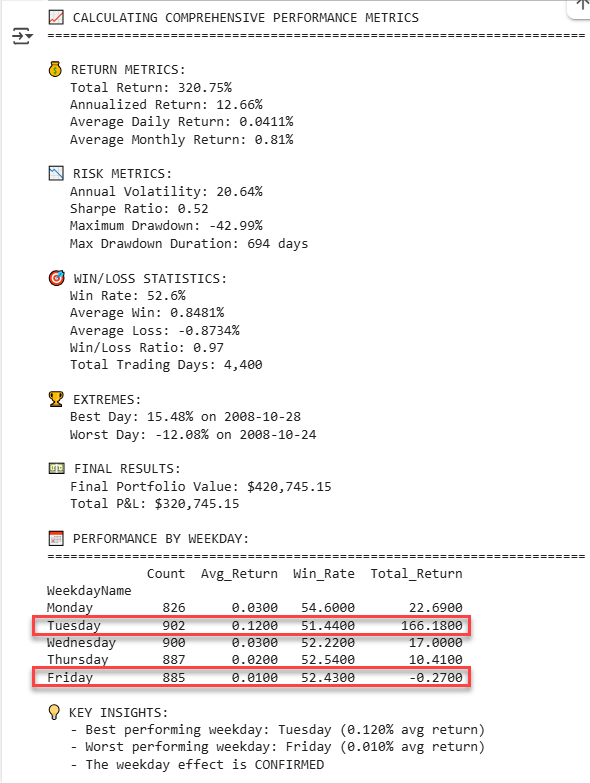
As you can see in the example above, Friday was the worst-performing day and Tuesday was the best…
…which later led me to update the code and add a 'skip day' option, allowing the strategy to avoid trading on specific weekdays.
STEP 7: COMPREHENSIVE VISUALIZATIONS
This step focused on creating multiple charts to visualize strategy performance, equity curve, heatmap and so on.
As you can see, the 7 steps cover a lot.

Is it everything you need to validate a trading strategy? No.
But it’s a solid starting point for testing an idea… fast and figuring out whether it’s worth digging deeper or just stopping right there.
And when I say fast, I mean it.
I did all of this in 4 or 5 hours.
The longest part?
Writing this post to show it to you :)
TL;DR
In summary, the strategy proved solid for index futures.
It seems there’s a weekday momentum edge, especially in the Nasdaq.
What I didn’t expect was such poor performance across other futures.
Although, to be fair, some results weren’t a total disaster:
Shorting metals delivered a positive return, and shorting softs was also slightly profitable.
The lookback period delivered consistent results across almost all combinations between 3 and 18 months.
I tested skipping between 0 and 2 months. Skipping 1 month made the strategy noticeably more robust.
As for decile percentiles and the minimum observations used to calculate the average, they had little to no impact on the results.
What’s Next
After the first test, a few ideas started popping into my head but I haven’t had time to test them all (yet).
Here are some hypotheses you could explore (using the full code I’m about to share below):
• What if I only go long when the first 30 minutes of the session close green?
• What if I shorten the momentum window from months to weeks?
• What if I use a daily stop instead of holding the position until the close?
• What if I only go long when price is above the 200-period moving average?
These are just a few possible variations, all based on a strategy that originally wasn’t even designed for futures.
As you can see, the possibilities are endless.
And what you (as a data-driven trader) need is a repeatable process that helps you figure out, fast, what’s worth digging deeper… and what’s not.
Because ideas are everywhere but wasting time on dead ends is expensive.
Some subscribers asked and I’m organizing a challenge to help you go from zero to a validated trading strategy in 30 days.
If you’re interested, hit reply and I’ll add you to the waitlist.
Because like I said before, it’s not about chasing the holy grail…
It’s about quickly identifying which ideas can be turned into robust, repeatable strategies that earn a spot in your portfolio.
Alright.
Now let me show you the full code plus a modified version to get you started.