
Why a Natural Gas Backtest Got Better Out-of-Sample (PF 1.66 → 3.53 Across 124 Trades)
And the 23 robustness tests I run on every trading strategy before going live...

Disclaimer: Educational content only, not financial advice. Trading involves substantial risk and isn't suitable for every investor. The code and analysis here are provided as-is, with no guarantee of accuracy or future performance. You are solely responsible for any decision to deploy this in live markets. Consult a licensed advisor before trading real capital. Use at your own risk.
1989.
I was 9 yo and I had this whole shoebox of GI Joe parts.
Not full figures but parts.
Heads, torsos, the little gray rifle that was always missing…
I’d sit on the floor of my room for hours combining them like Destro’s head on Duke’s body for example.
And tbh Hasbro did some weird stuff too like Snake Eyes mixed with Flash…

That was a cool one but most of it didn’t work.
Once in a while a combination would feel right and friends would come over and want to play with my weird kitbashes.
I never knew why some combinations clicked and others didn’t. I was nine. I was just testing.
Thirty-seven years later I'm still doing the same thing.
The shoebox is now a folder (or several) on my notebook.
The parts are indicators, half-tested strategies, ideas from books, papers, magazines, YouTube videos. Stuff I copied into notes pretty much every day.
But the instinct is the same.
I take two things that don’t obviously go together and I run them.
This is one of those.
Where the two ideas came from.
The first idea I found was inside an old TASC magazine…
TASC is a great source of ideas, by the way.
Not for finished validated strategies (almost nothing is live-ready, including this strategy that I’m about to tell you) but as a source of building blocks to combine with other stuff, it's extremely useful.
Don't throw away any kind of ideas you collect, especially nowadays when you can just feed a few ideas into an LLM like Codex and ask for variations to test (just a tip :))
The rest of the strategy I took from Build Alpha (by the way, if you're interested in the tool, send me a message I have something for you).
I combined them and then I was ready to test it on Natural Gas.
The first run.
Setup, in plain language:
• Asset: NG (Natural Gas Futures continuous contract)
• Timeframe: daily bars (1440-min)
• Backtest window: 2015-01-01 → 2024-12-31 (10 years). 2025 and 2026 deliberately left out as live.
• Costs: $2.50 commission + $17.50 slippage per side, $40 round-trip per closed trade.
The core idea was:
Compressed stochastic between two thresholds. Skip the bar if the recent pivot low has cracked. Buy next bar at market.
For the exit I picked something I’d seen in another system of mine: flat the position when the next open prints below the current bar’s typical price.
That’s it.
So I hit 'Enter'…
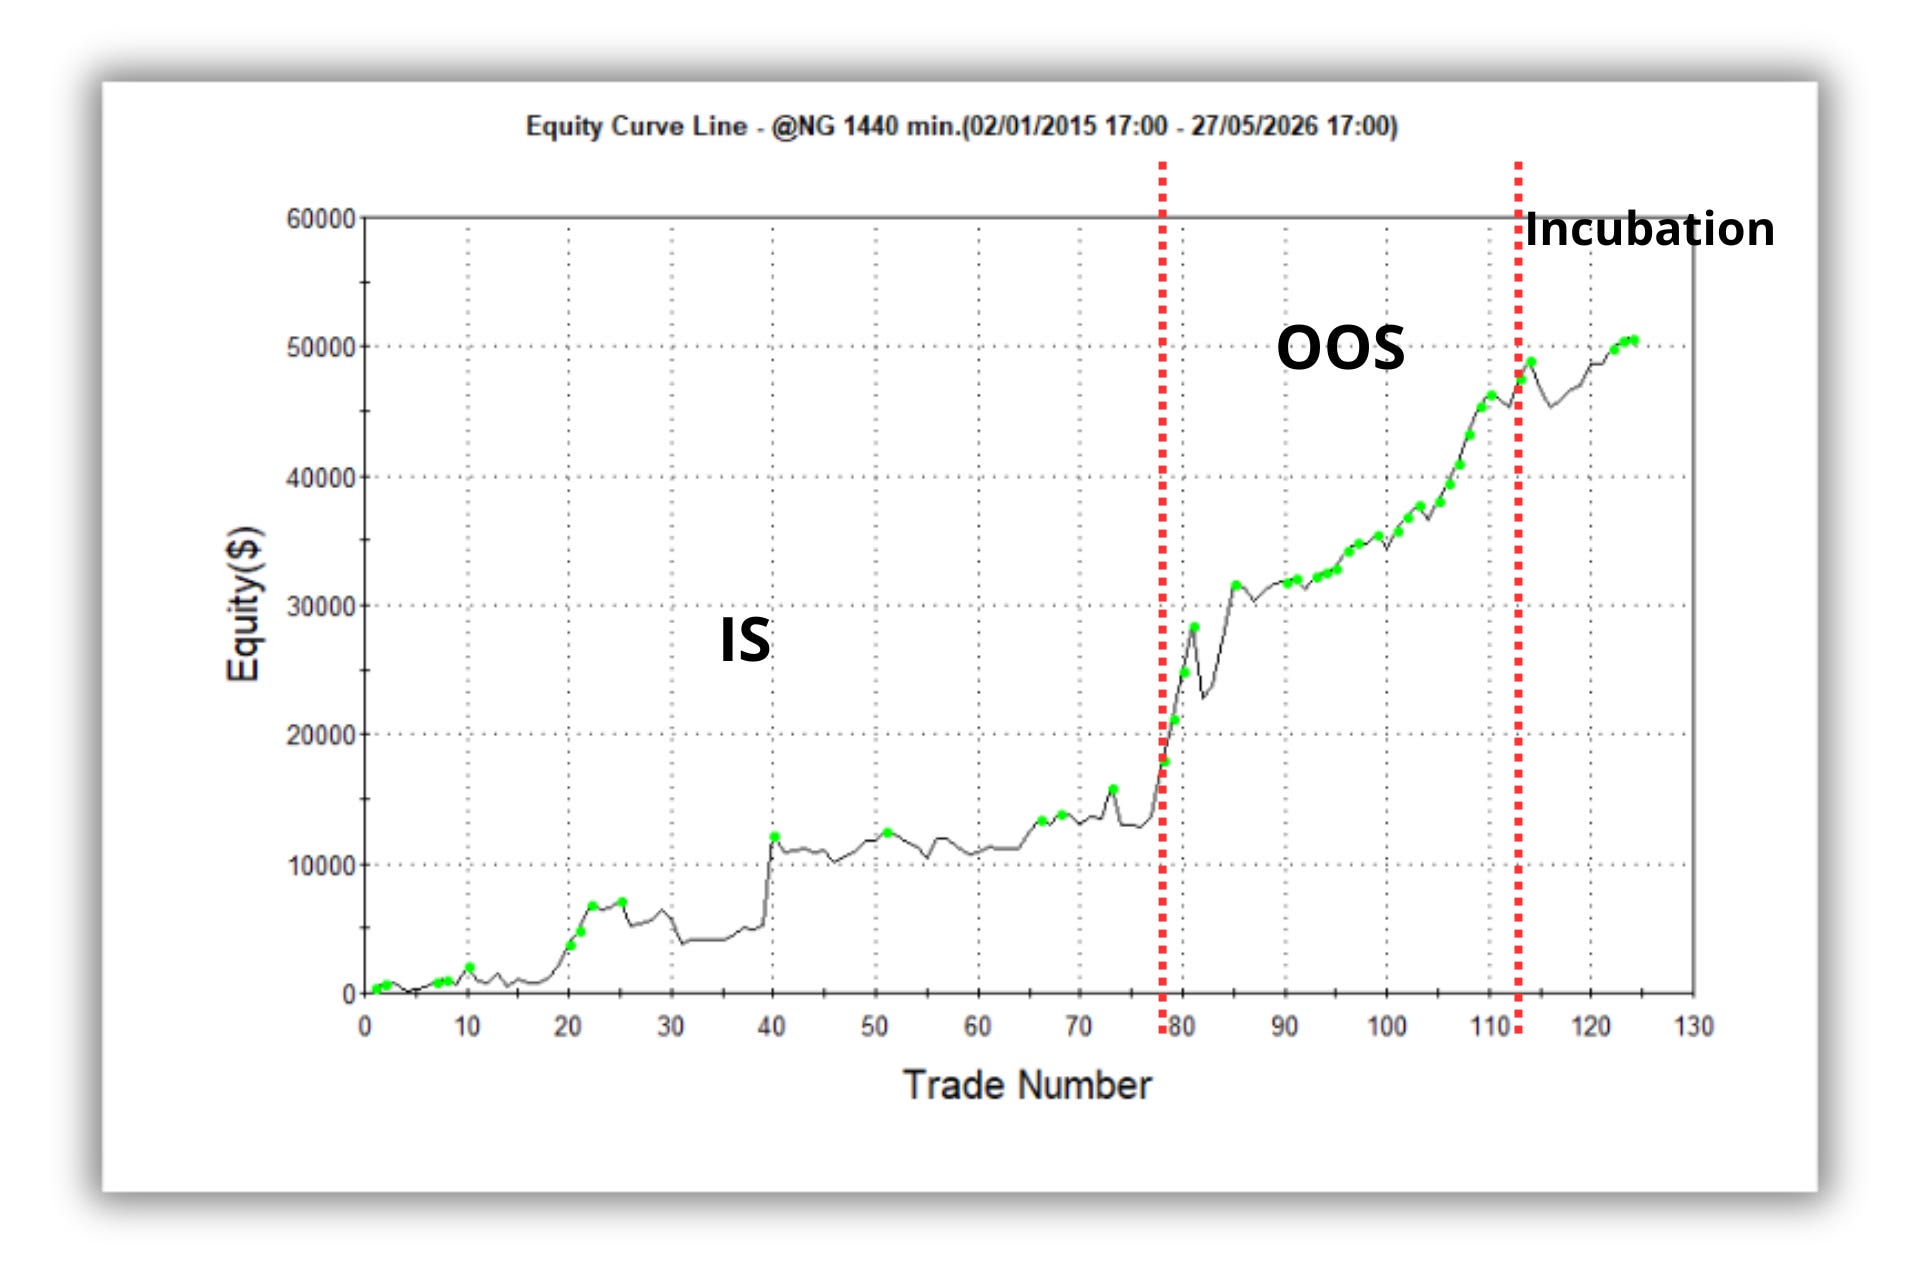
One of the most striking findings was that the Out-of-Sample (OOS) period performed much better than the In-Sample (IS) phase.
In the IS data, a flat performance stands out between roughly trades 40 and 70 as you will see below.
Interestingly, the incubation period (2025 and 2026) maintains a very similar slope to the OOS curve.
TL;DR
Ten years of @NG data — 2015 through end-2024. I ran the in-sample fit on the first seven (2015 → end-2021). Three years held out.
Then I ran the strategy on the three years of out-of-sample data — 2022 to end-2024 that I hadn’t fitted on.
Profit factor went from 1.66 to 3.53. Win rate from 58.7% to 74.2%. Average trade from $174 to $854.
I added 2025 and the first five months of 2026, all of it data the rule had never seen. Eighteen more trades. PF 3.36. Win rate 77.8%.
Same rules. Three windows. The thing got better, then it stayed better (at least for now…)
Here’s what the whole thing looks like end to end.
Solid numbers, but so what?
Ready to push live?
Not so fast.
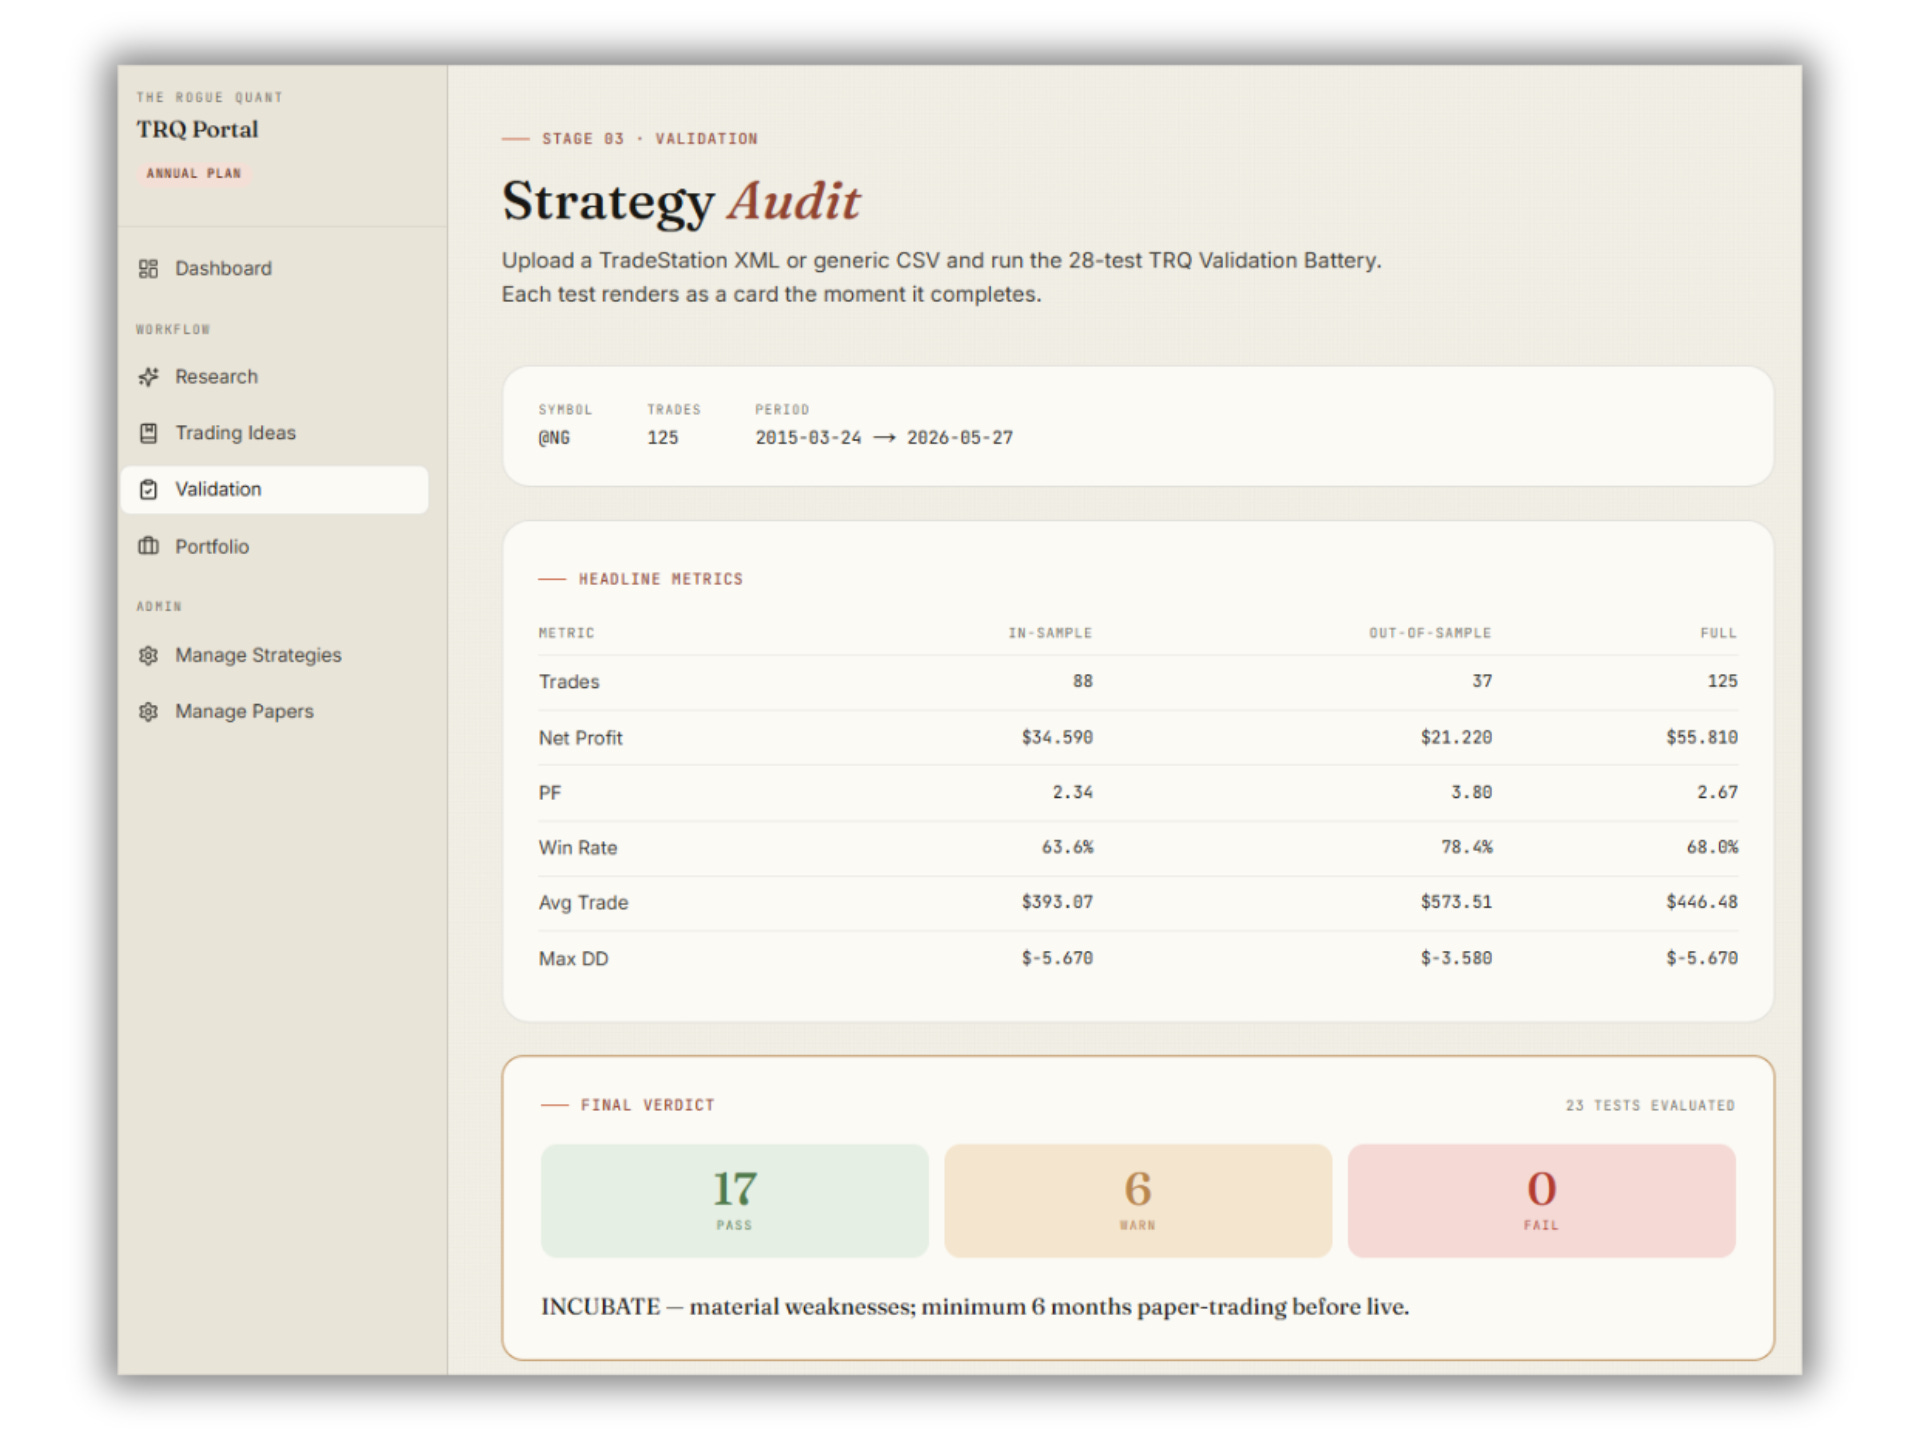
I didn’t run walk-forward optimization on this one yet. But I did run twenty-eight statistical tests on it (the same battery anyone can run on their own csv files over at The Rogue Quant Portal, under “Validation”).
Let’s see some of these tests…
How much capital does this thing actually want.
First thing the audit picks at is the capital baseline.
Doesn’t matter that the strategy printed $50k on paper if the worst trade is bigger than the account you’d run it on.
The Capital-Sizing test bootstraps ten thousand simulated years of trading at every plausible starting equity.
For each one it tracks how often the account hits ruin, what the median annual return looks like, and what the median drawdown costs.
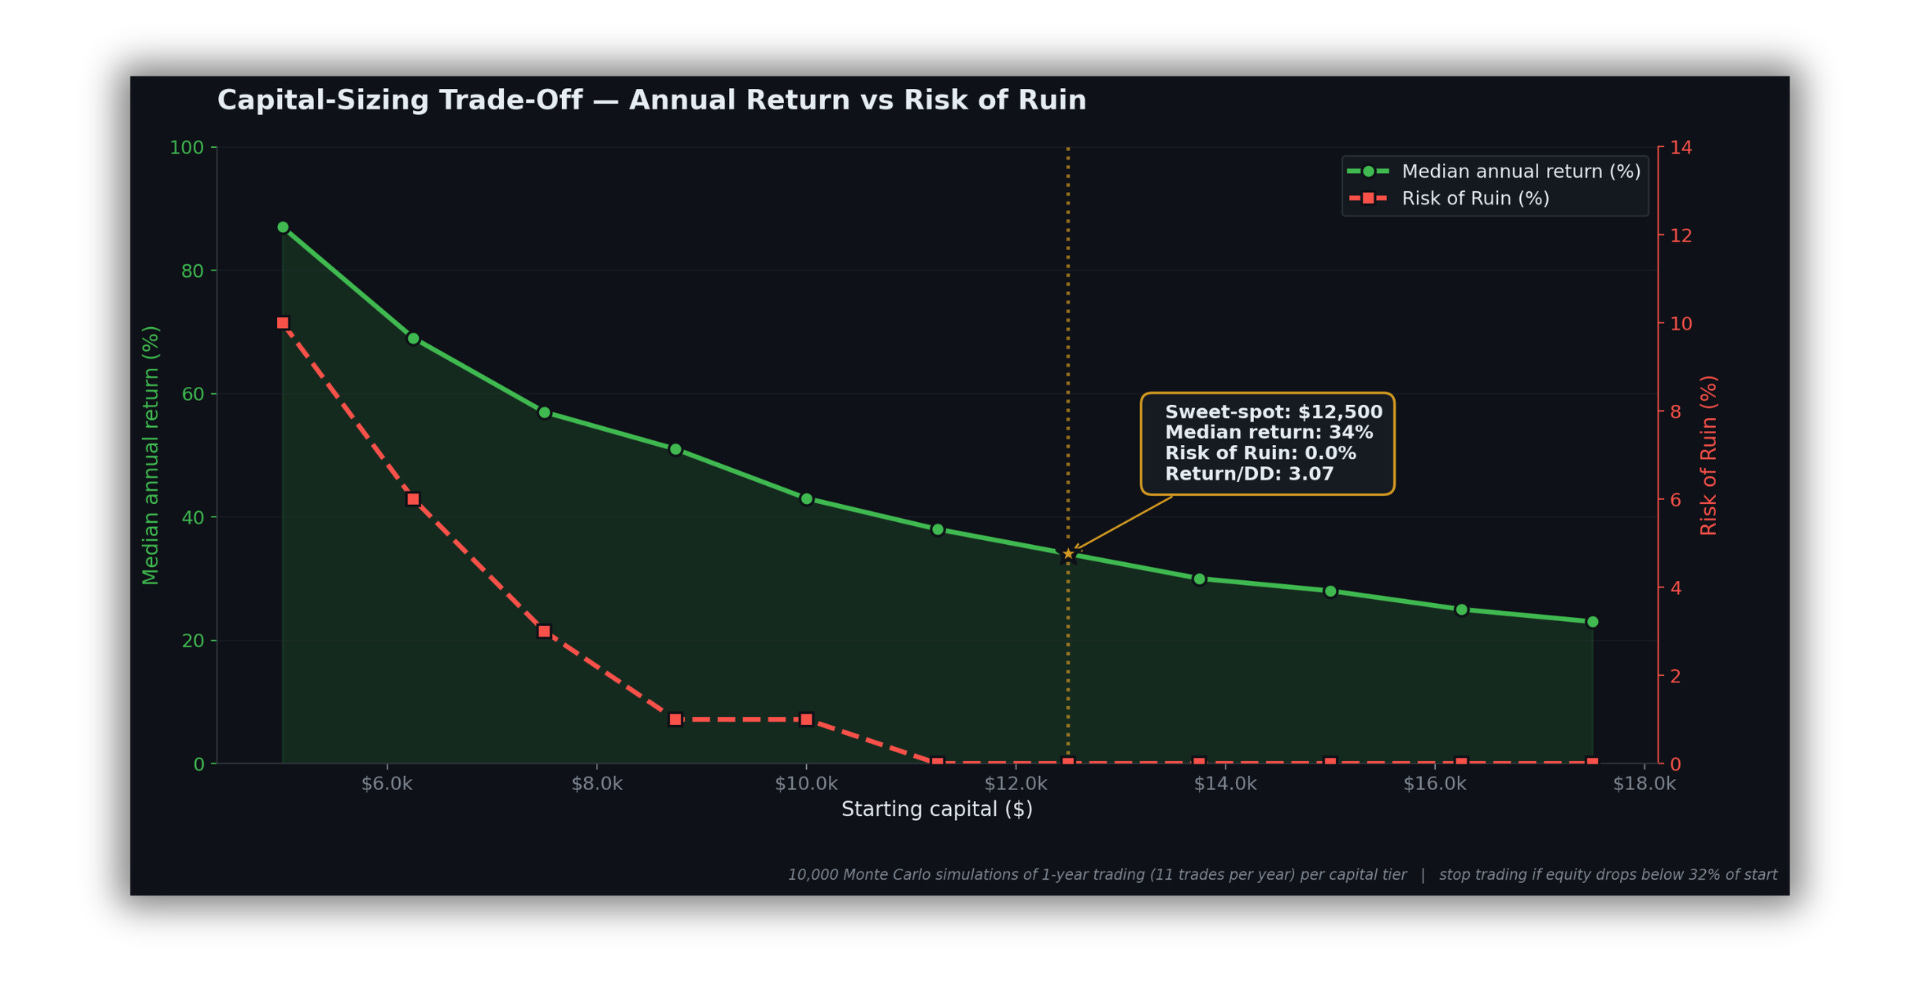
The red dashed line is Risk of Ruin.
The green line is the median annual return.
They cross each other as capital grows. At $5k you blow up in 10% of simulated years, at $11,250 ruin hits zero.
The sweet-spot, first tier with Ruin = 0 and Return/DD still above 3, is $12,500. About four times the NG maintenance margin.
At that baseline: median annual P&L $4,200 (+34%), median drawdown 10.9%, Return/DD 3.07, and 84% of simulated years finish positive.
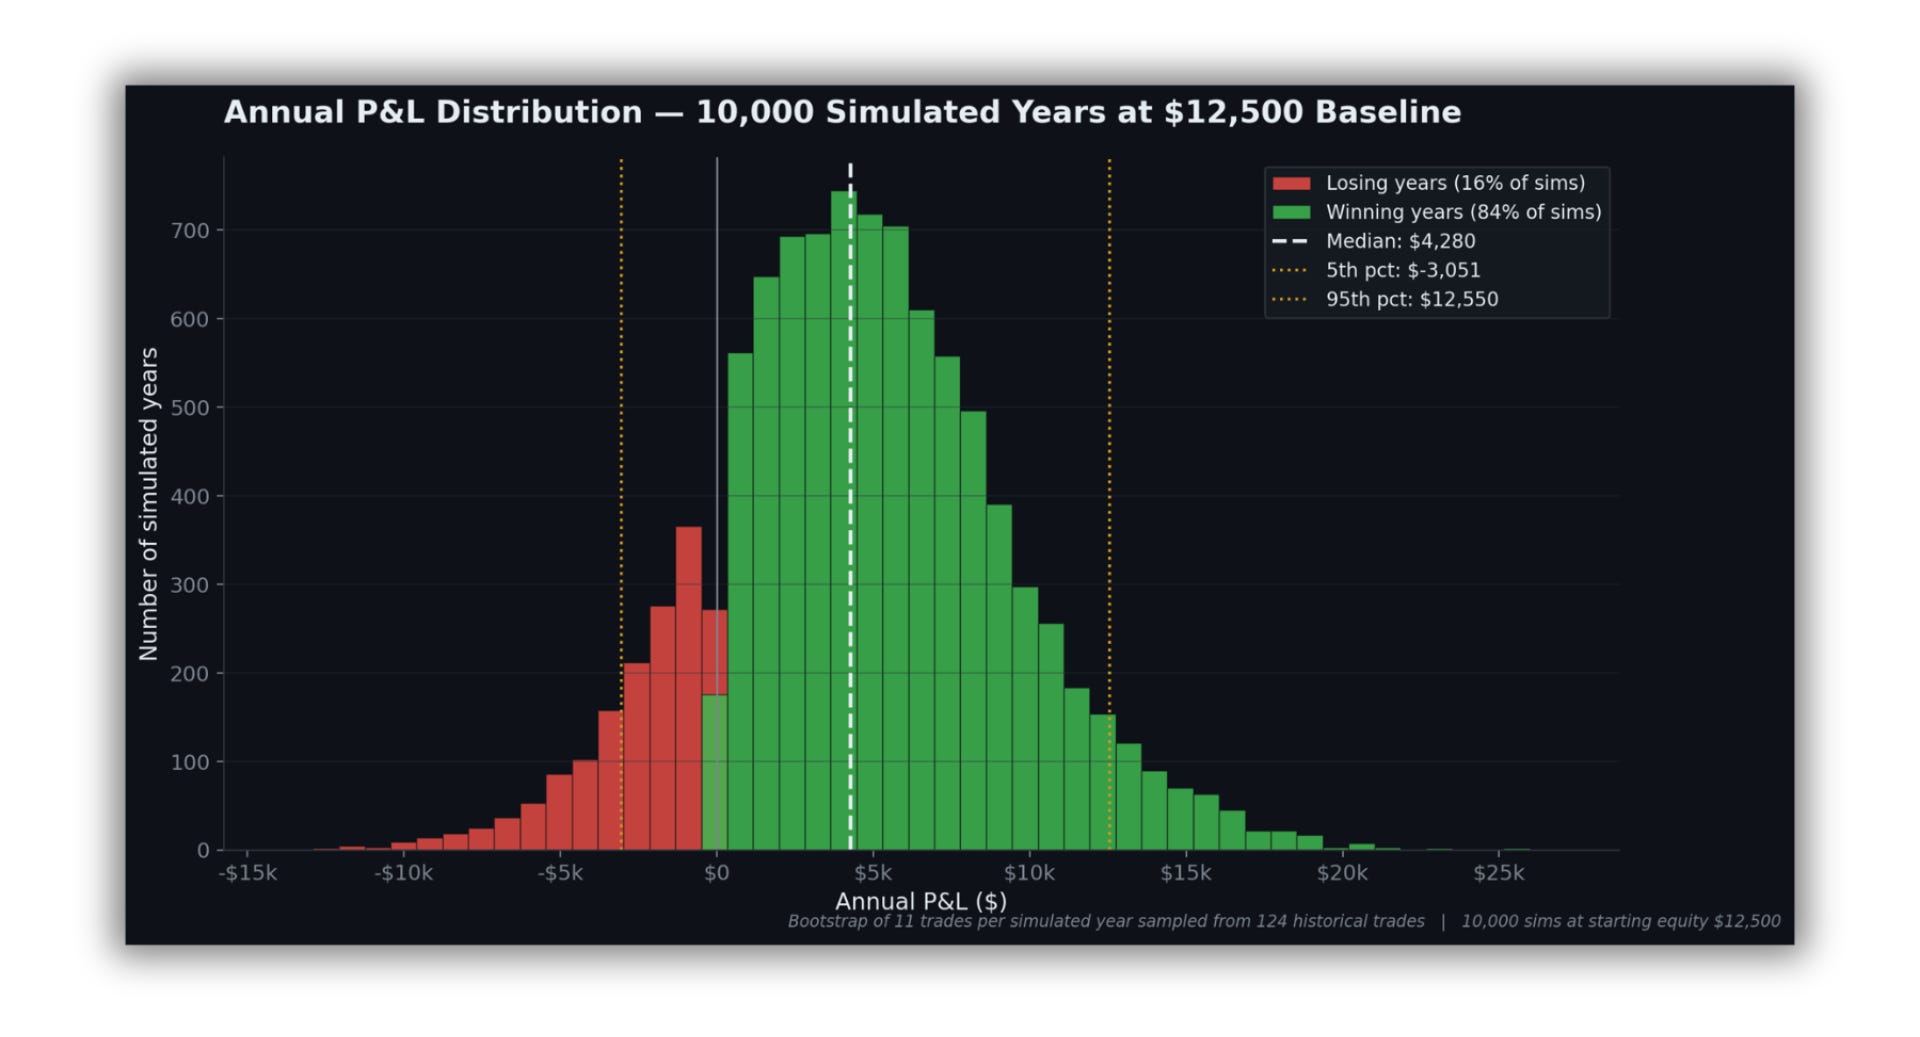
What a thousand simulated years actually look like.
Median sits at +$4,280.
The 5th percentile (a genuinely bad year) lands at –$3,051.
The 95th percentile (a good one) at +$12,550.
Sixteen percent of simulated years are losing years. None of them blow the account up, but they're real and you need to be able to sit through one.
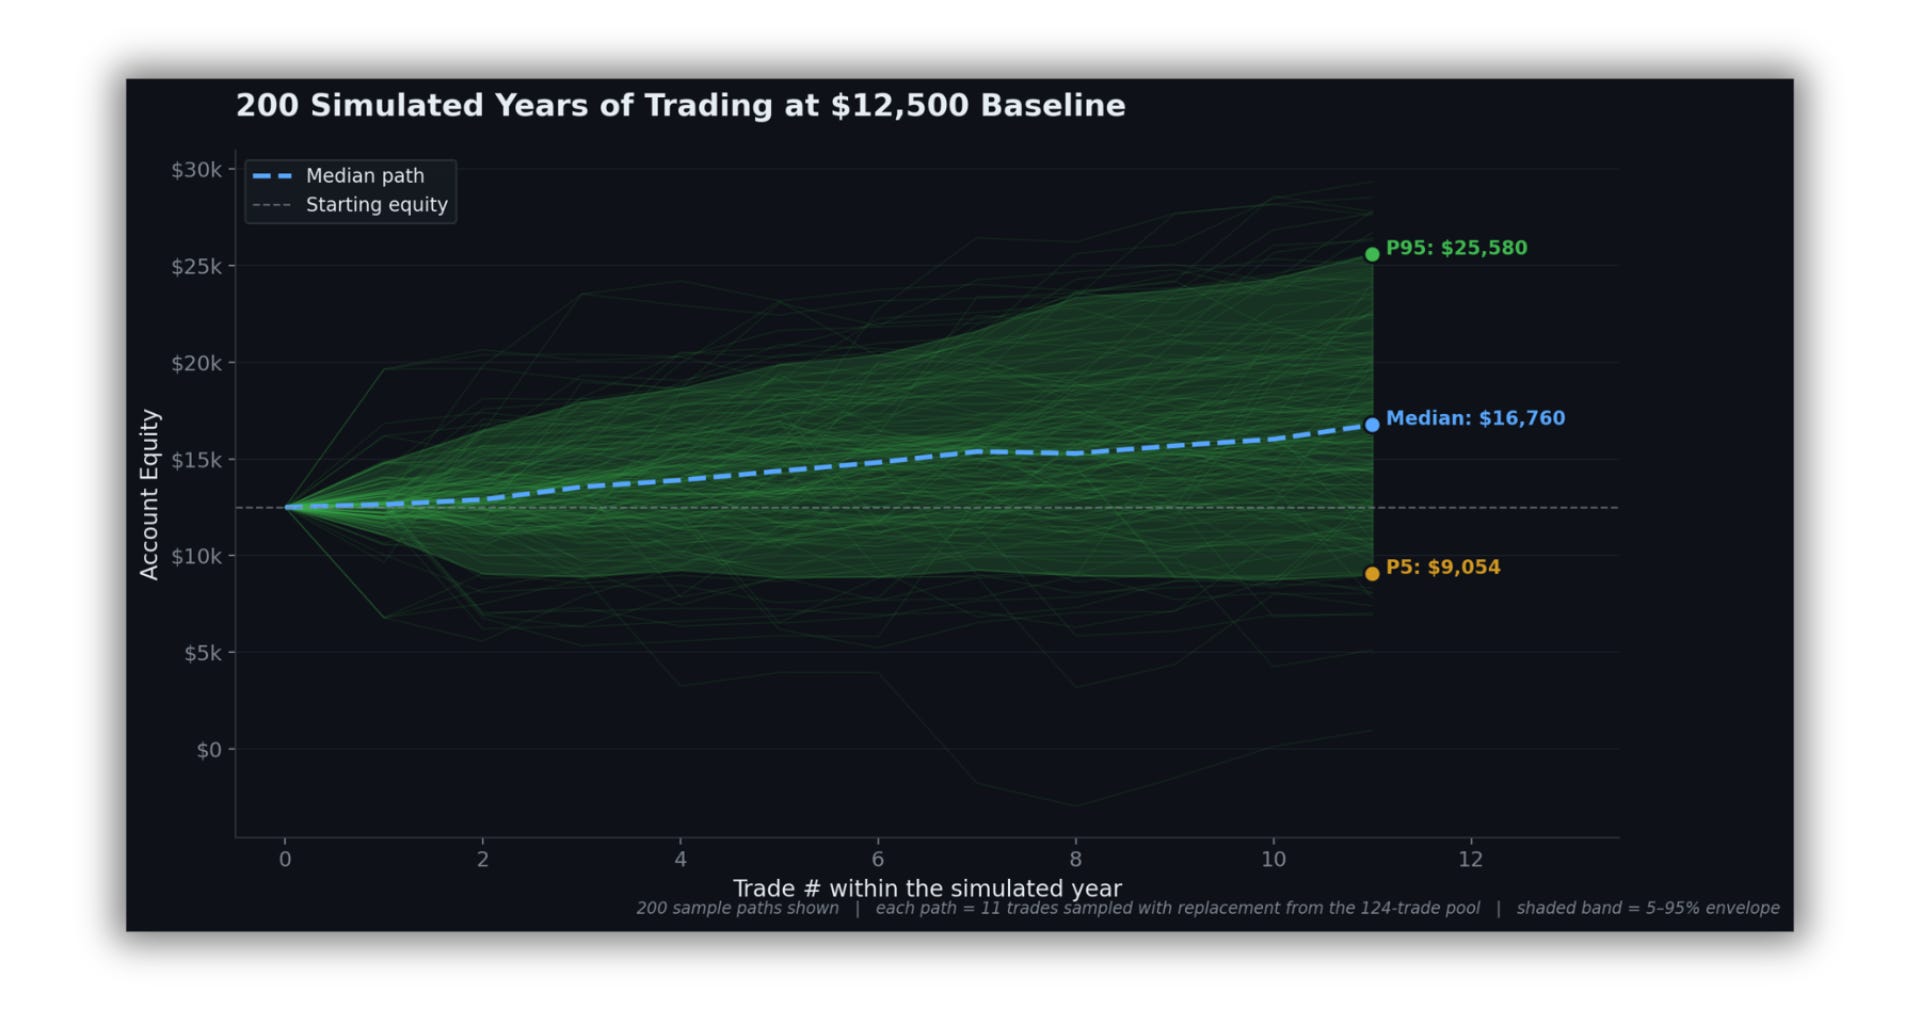
The fan chart below is two hundred sample paths walked trade by trade across a single year.
P5 finishes at $9,054, median at $16,760, P95 at $25,580.
You can see survival and an unusually good year in the same frame.
So the equity curve, scaled to a real-world account.
Same trades, scaled to the account size the strategy actually wants needs.
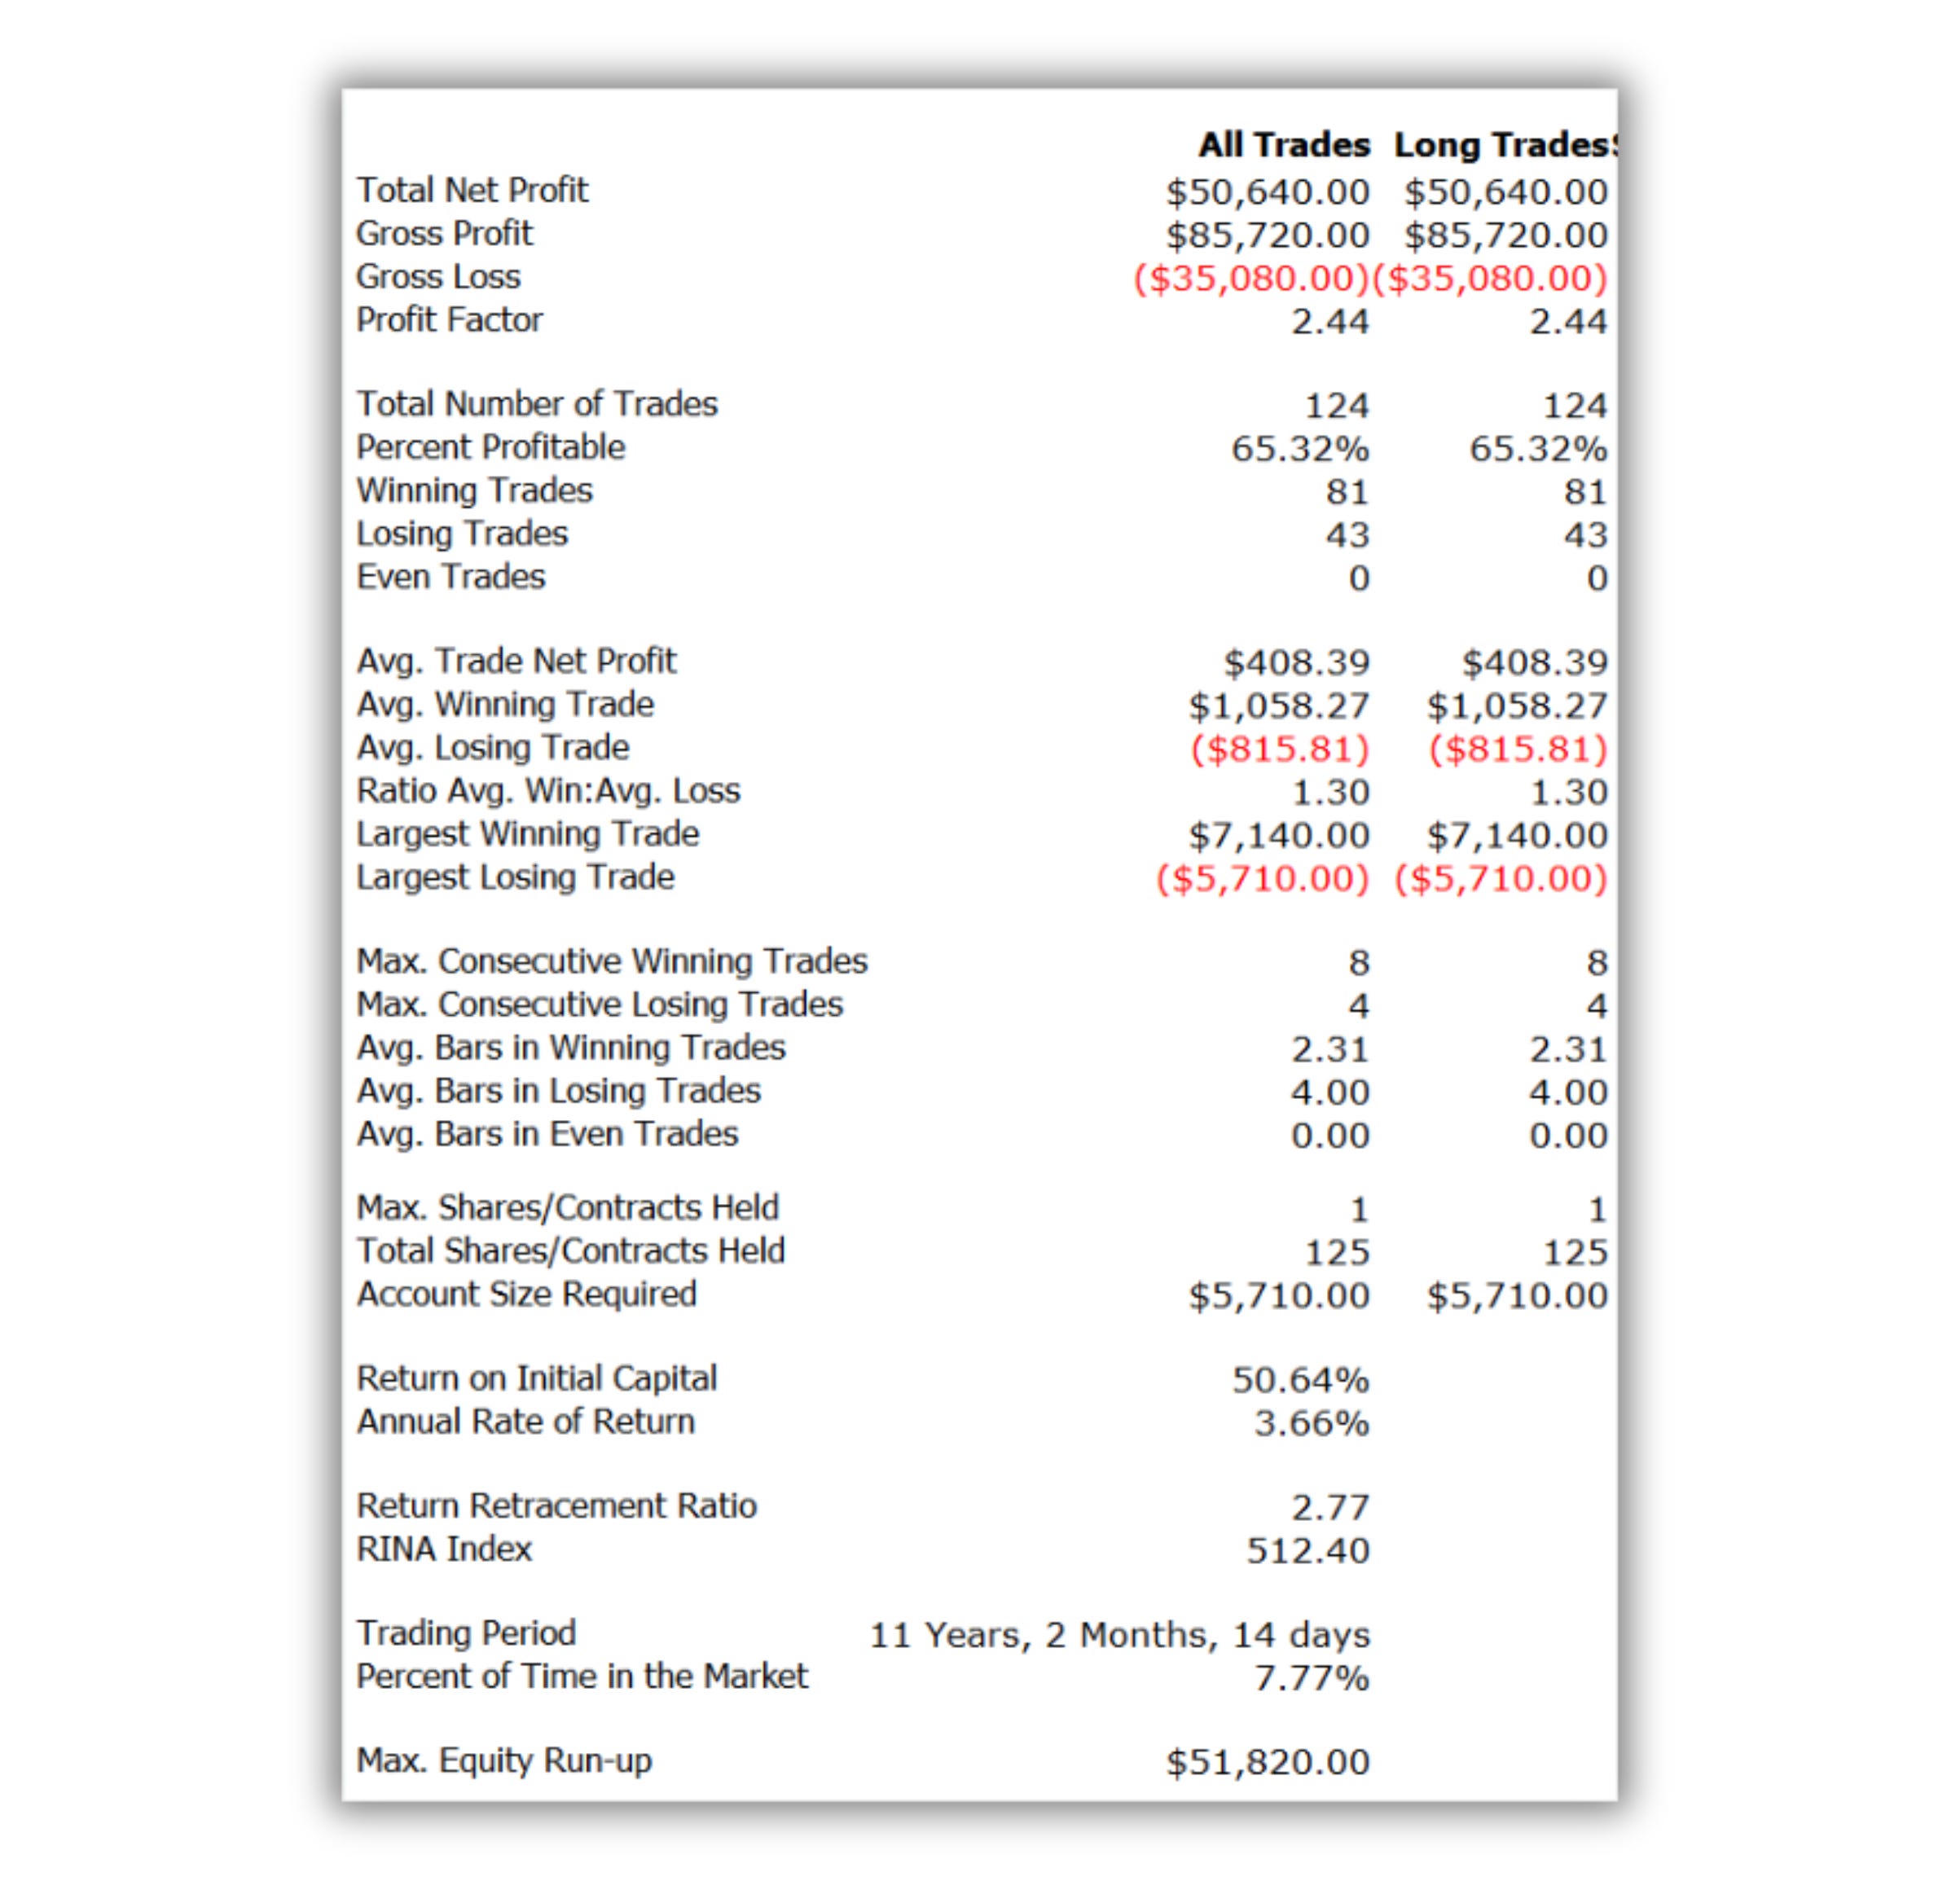
Eleven years, +$50,640 on $12,500 of starting capital. The curve compounds by about a factor of five.
This is the version of the equity curve to look at.
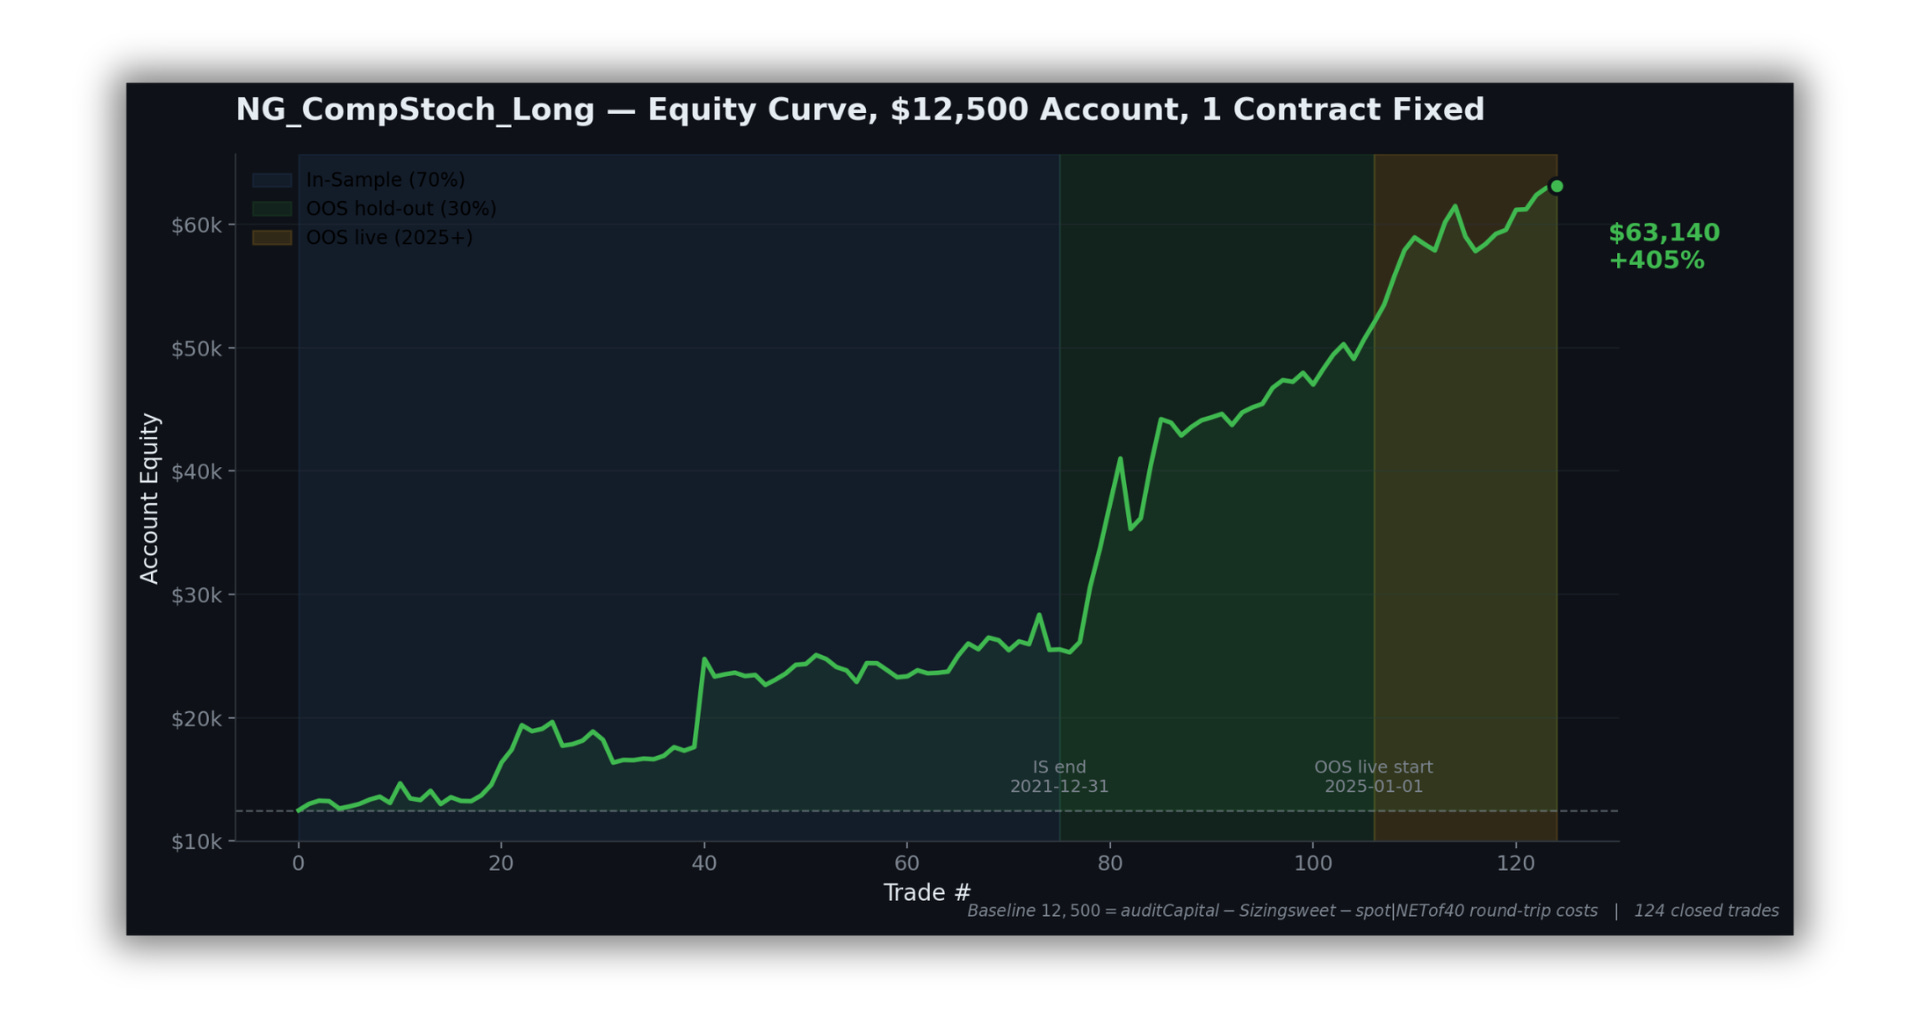
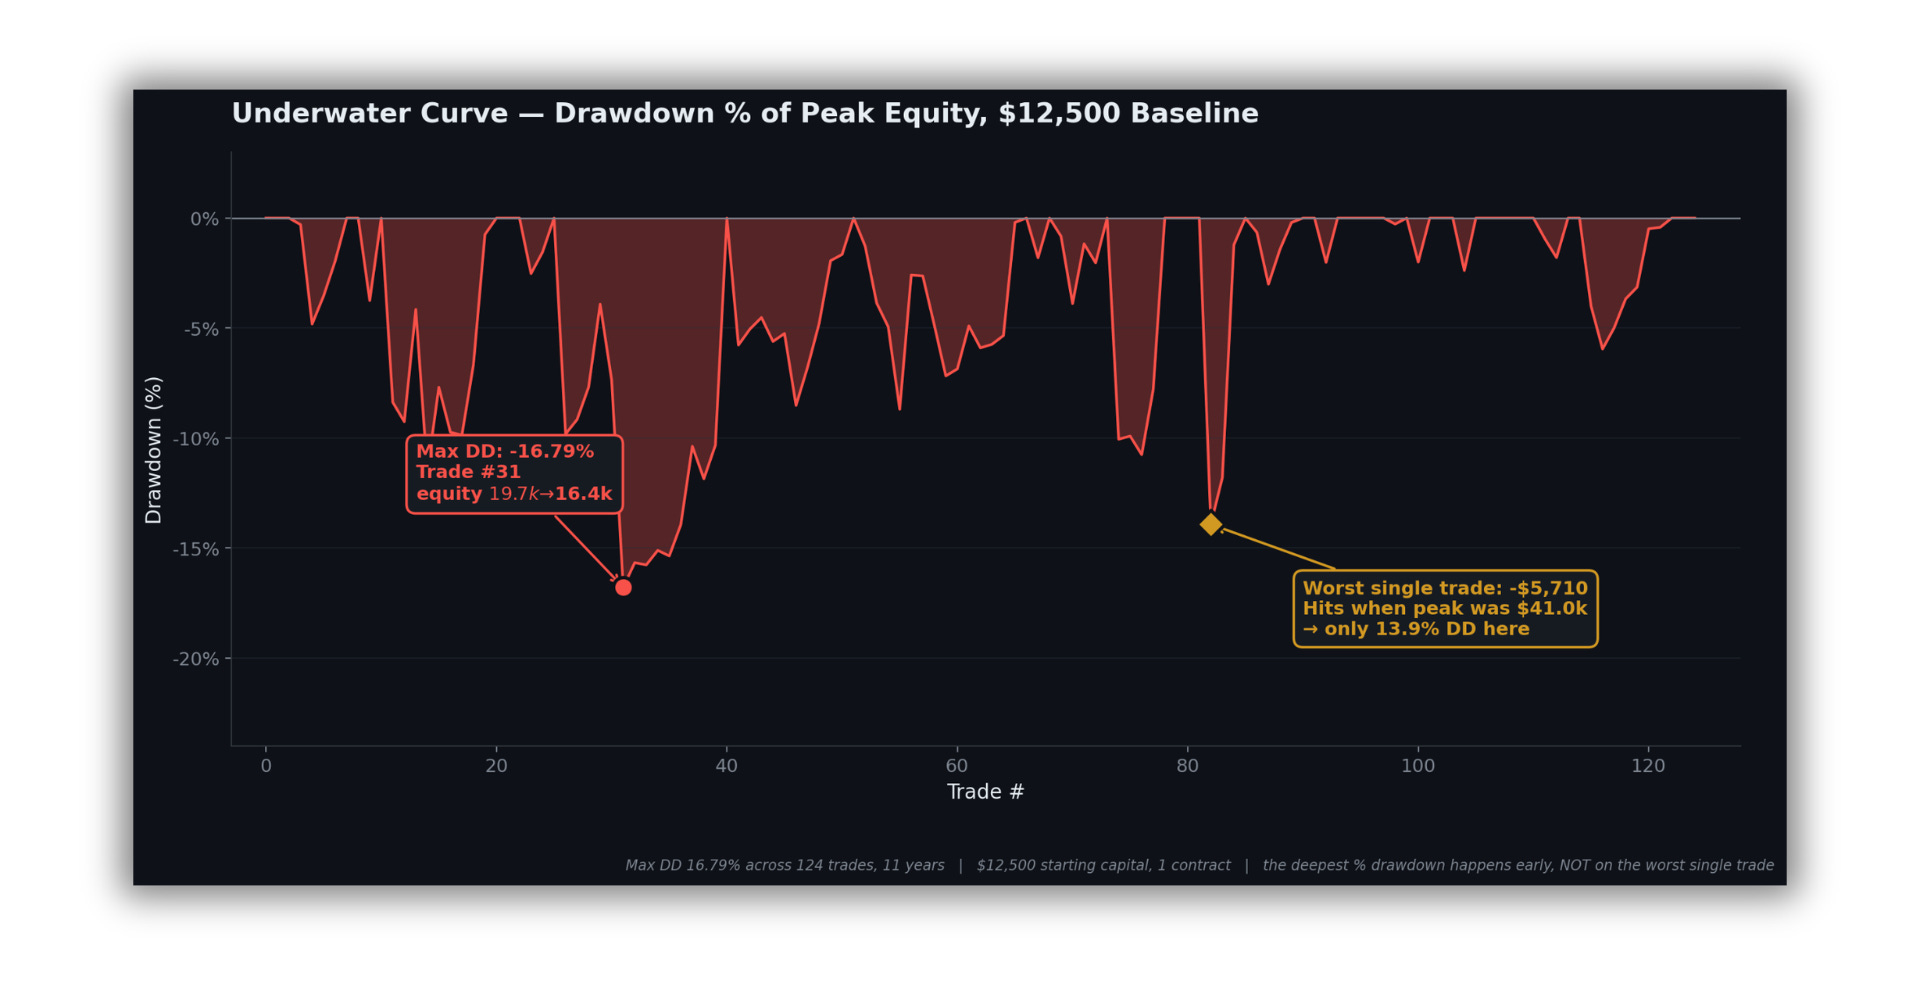
The worst peak-to-trough on this strategy at $12,500 is 16.79%, and it doesn't happen where you'd expect.
It's not the −$5,710 (worst) single trade. That one hit when the account had already compounded to $41k, so the damage was "only" 13.9%.
The deepest % drawdown happens at trade #31, early, when a sequence of smaller losses lands on an account that hadn't grown yet. The first thirty trades are where the test is.
A few other numbers from the Validation Module
T17 — Statistical significance.
The probability that an edge this strong shows up by chance with no real signal underneath is 0.0020. Roughly one in five hundred. Bootstrap the trades against a zero-edge null and the observed mean falls outside the noise distribution 99.8% of the time.
T03 — Ordering luck.
Take the same 124 trades and reshuffle the order two thousand different ways. The historical chronological sequence produced a Max DD of $5,710, which landed in the shallowest 8% of all possible orderings. The median reshuffling would have produced a $6,970 DD (22% deeper). The 5th-percentile reshuffling (a plausibly unlucky path) would have hit −$10,781.
T20 — How wide the edge really is.
Bootstrap the profit factor a thousand times. The 95% confidence interval lands at [1.31, 4.29]. The lower bound — the cautious read — is still meaningfully profitable.
T27 — Cost stress.
Triple the slippage and commission (round-trip from $40 to $120). The strategy still prints PF 2.05. Most edges I’ve audited collapse at 2× costs. This one survives 3×.
T28 — Regime breadth.
Slice the eleven years into macro environments (bull, bear, high-vol, low-vol, mixed). The strategy stays profitable in 80% of qualifying regimes, clearing the audit’s minimum bar. Not one tailwind carrying everything.
T19 — The technical one, for the people who care.
T19 applies Timothy Masters’ (one of my fav authors) 10× effect adjustment for selection bias, then double-bootstraps the drawdown distribution. The 85%-confidence upper bound on max drawdown comes in at −$17,625, meaning even after accounting for the “you only show me the strategies that worked” problem, the worst-expected drawdown still sits inside roughly three times the historical $5,710.

Btw you can access the TRQ Portal here:
If you want what's inside the box.
I never figured out why some GI Joe combinations clicked and others didn’t…
The combinations that worked weren’t engineered they just felt right when I picked them up, and then I’d play with them until they didn’t.
I’m not going to pretend the grown-up version is much different.
Sometimes what we do as systematic traders makes sense, sometimes I got results I can’t fully explain and that’s fine for me.
In this case, eleven years of data, the audit’s hardest test came back at the top of the scale, and out-of-sample beat in-sample by a factor of two.
Like I always say, no matter how pretty the equity curve is, no matter how clean the backtest numbers come out, the only thing that really matters is live trading.
But obviously, you’d rather go to war with your GI Joes armed to the teeth than face the Cobras empty-handed.

Same applies to your backtesting process.
Better to know your strategy passed a rigorous development and validation pipeline than to push live with something that would fail the simplest overfit test.
Anyway, here are the missing parts of this strategy. But before I share the full code with you, if you’re already a subscriber, thank you.
If not, here’s what you’re missing:
Inside TRQ Portal:
Strategy Archive. Every strategy I publish, end to end. EasyLanguage source. Plain-English logic. Full parameter table. The closed-trade list. This NG study included — partition timestamps, parameter sensitivity sweep, all of it.
Validation Battery. The 28-test audit the post just walked through, pointed at your data. Drop a CSV or TradeStation XML, get a verdict in 30 seconds. Deflated Sharpe corrected for the variants you tried. Regime-sliced profit factor. BCa bootstrap. Pass, warn, or fail per test — with the formula on every card.
Quant Papers. Academic strategies replicated from scratch, then ranked Strong / High / Moderate / Weak by what held up on my data. Not what the abstract claimed. A lot of backtests with equity curves and reference code in queue, the rest as structured summaries while I work through them. The catalog is the filter.
Portfolio Analyst. Drop multiple trade lists, get the book. Stress-period correlation vs normal correlation — never the same. Leave-one-out: which strategy actually pulls weight, which one just levers an exposure you already have. Year-by-month heatmap with annual totals. Monte Carlo on resampled orderings. Five minutes here replaces the diversification spreadsheet you keep meaning to build.
CoT Edge. Every CFTC release converted into three-year percentile context across ~50 markets. Asset Managers, Leveraged Money, Producer/Merchant, Managed Money — every category, every week. Week-over-week shifts ranked. Positioning combined with price, because 99th-percentile long at a price high reads as distribution, not setup. Friday afternoon, every Friday.
Seasonal Lab. Decades of calendar data across thirty-plus futures, sliced five ways. Monthly heatmap. Daily seasonality curve with confidence bands — the band matters more than the line. Day-of-week breakdown. Curated entry/exit windows ranked by historical Sharpe, with an “active now” filter for the week. Catches real patterns. Ignores imagined ones.
One login. Annual subscription covers everything.
Ok, let’s move…
