
The Quiet Breakout Edge I Found While Trying to Improve a “Good” Strategy
Momentum fading right before expansion sounds wrong… until you see the results...

This week I was working on a concept to share with my founding members…
A breakout strategy on Copper.
This is what I got…
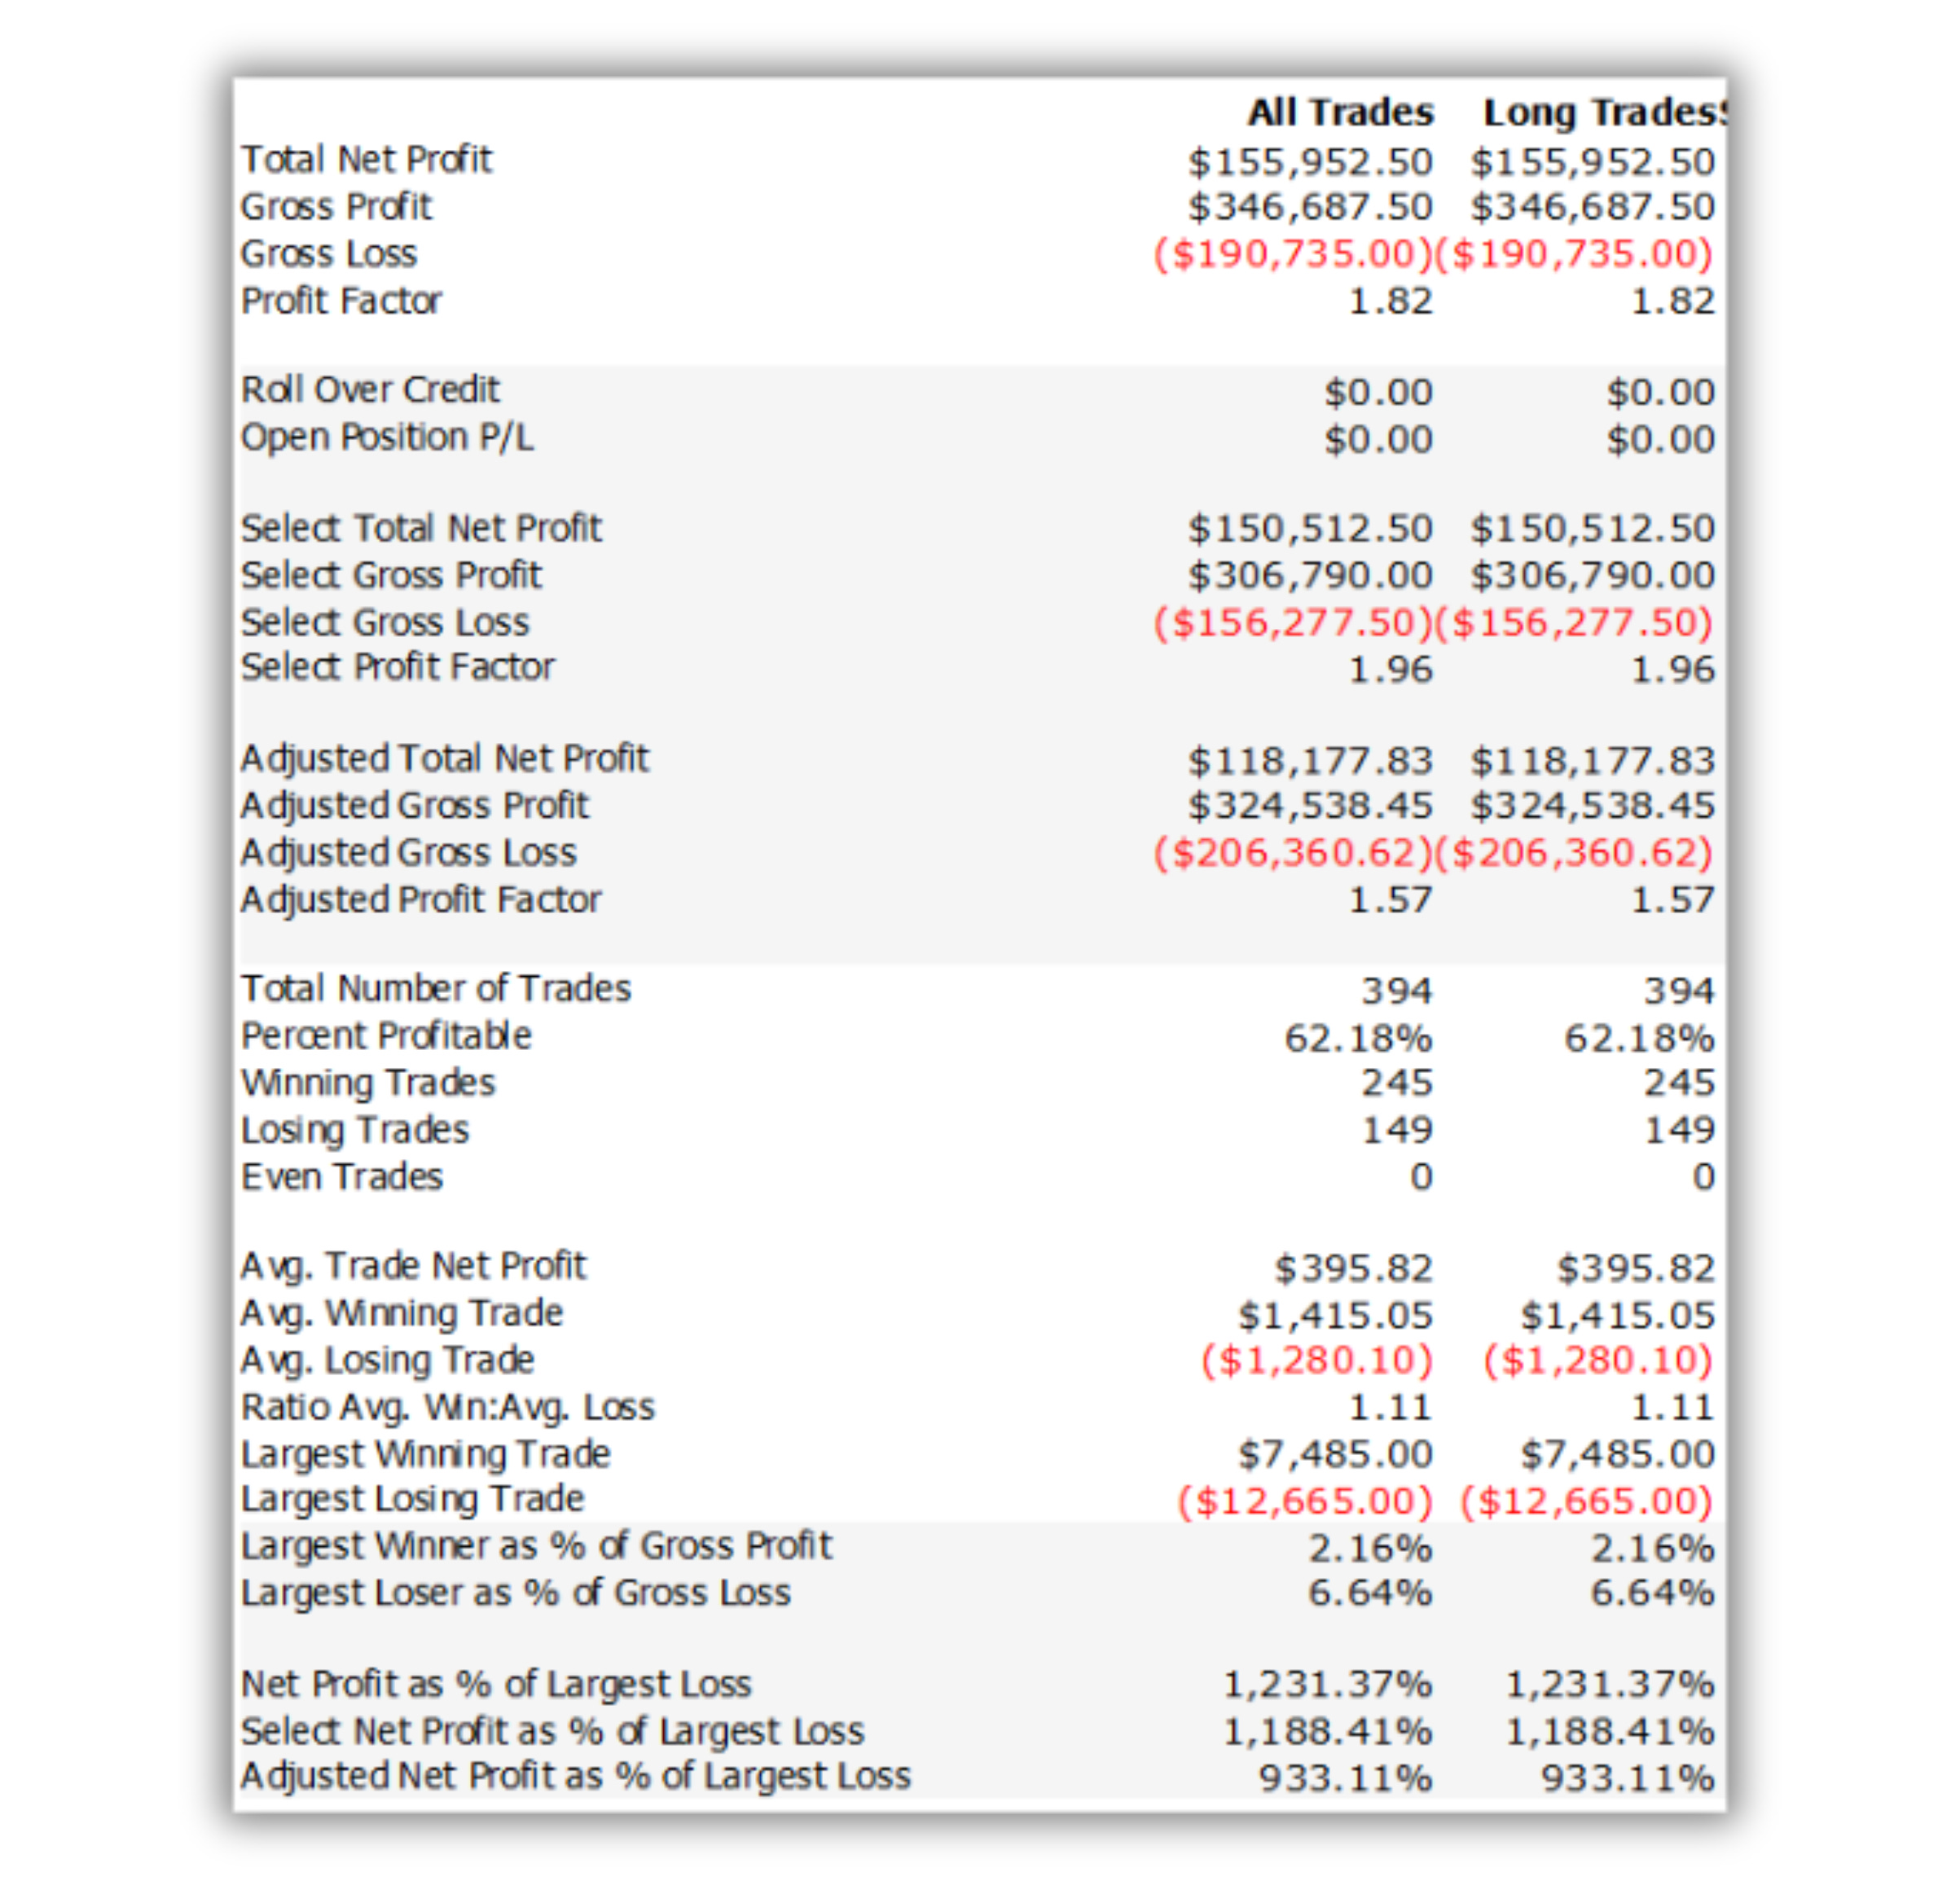
1.82 Profit Factor. 394 trades. 62% win rate.
Not bad.

But then I added one momentum condition and…
2.71 Profit Factor. 78% win rate. Average trade nearly doubled.

Same market. Same breakout logic. One filter.
But here’s the weird part...
The filter doesn’t do what you’d expect.
Most traders add momentum to breakout systems looking for acceleration.
Buy when price breaks out AND momentum is rising.
Strength confirming strength.
Makes perfect sense.
Except that’s not what worked.

My best filter buys breakouts when short-term momentum is declining.
Not rising.
It sounds backwards. Buying strength when momentum is getting weaker?
But the data doesn’t lie.
16 years of testing. Only 3 negative years.
Here’s what you’ll see today:
The counterintuitive momentum filter that turned a good system into a 78% win rate machine
Why buying breakouts when short-term momentum is declining actually makes sense
Full strategy code + complete backtest results
Let’s go.
THE SETUP
I’m going to walk through exactly how I tested this.
I always say that bad testing kills more accounts than bad strategies.
So here’s my overall backtesting framework for Copper:
Instrument: Copper Futures (@HG)
Data: Daily bars (1440 min)
Period: January 2010 through January 2026
Costs: $35 slippage + $5 commission per round turn
Position: One contract
The 16-year window splits into three parts:
Training period: Jan 2010 - Dec 2019 (10 years)
Validation period: Jan 2020 - Dec 2024 (5 years)
Blind period: All of 2025 (completely untouched)
Minimum trade requirements:
50+ trades in training
50+ trades in validation
That blind period matters because it’s kind of forced forward testing.
We’ll see what happened there in a minute…

Why Buying Weakness Inside Strength Actually Works
This is a range breakout system.
Simple concept.
Price compresses into a tight range. Volatility drops. Energy builds. Eventually it explodes one direction or the other.
I coded it up, ran it on Copper:
1.82 Profit Factor. 394 trades. 62% win rate.
Good results. But since I was testing one rule, I figured I'd add a second one.
So I did the obvious…
I added a momentum filter.
Buy the breakout, but only when momentum is also rising. Strength confirming strength.
It improved things a little. Profit Factor went from 1.82 to 1.92.
But… did I just add an entire rule to my system... for 0.1 improvement?
That’s when I had the thought:
What if I flip the logic?
Instead of buying breakouts when momentum is rising... what if I buy them when momentum is declining?
It sounded stupid.
I ran it anyway…

The Part Where One Condition Doubles Your Average Trade
When I added that declining momentum filter, here's what happened:
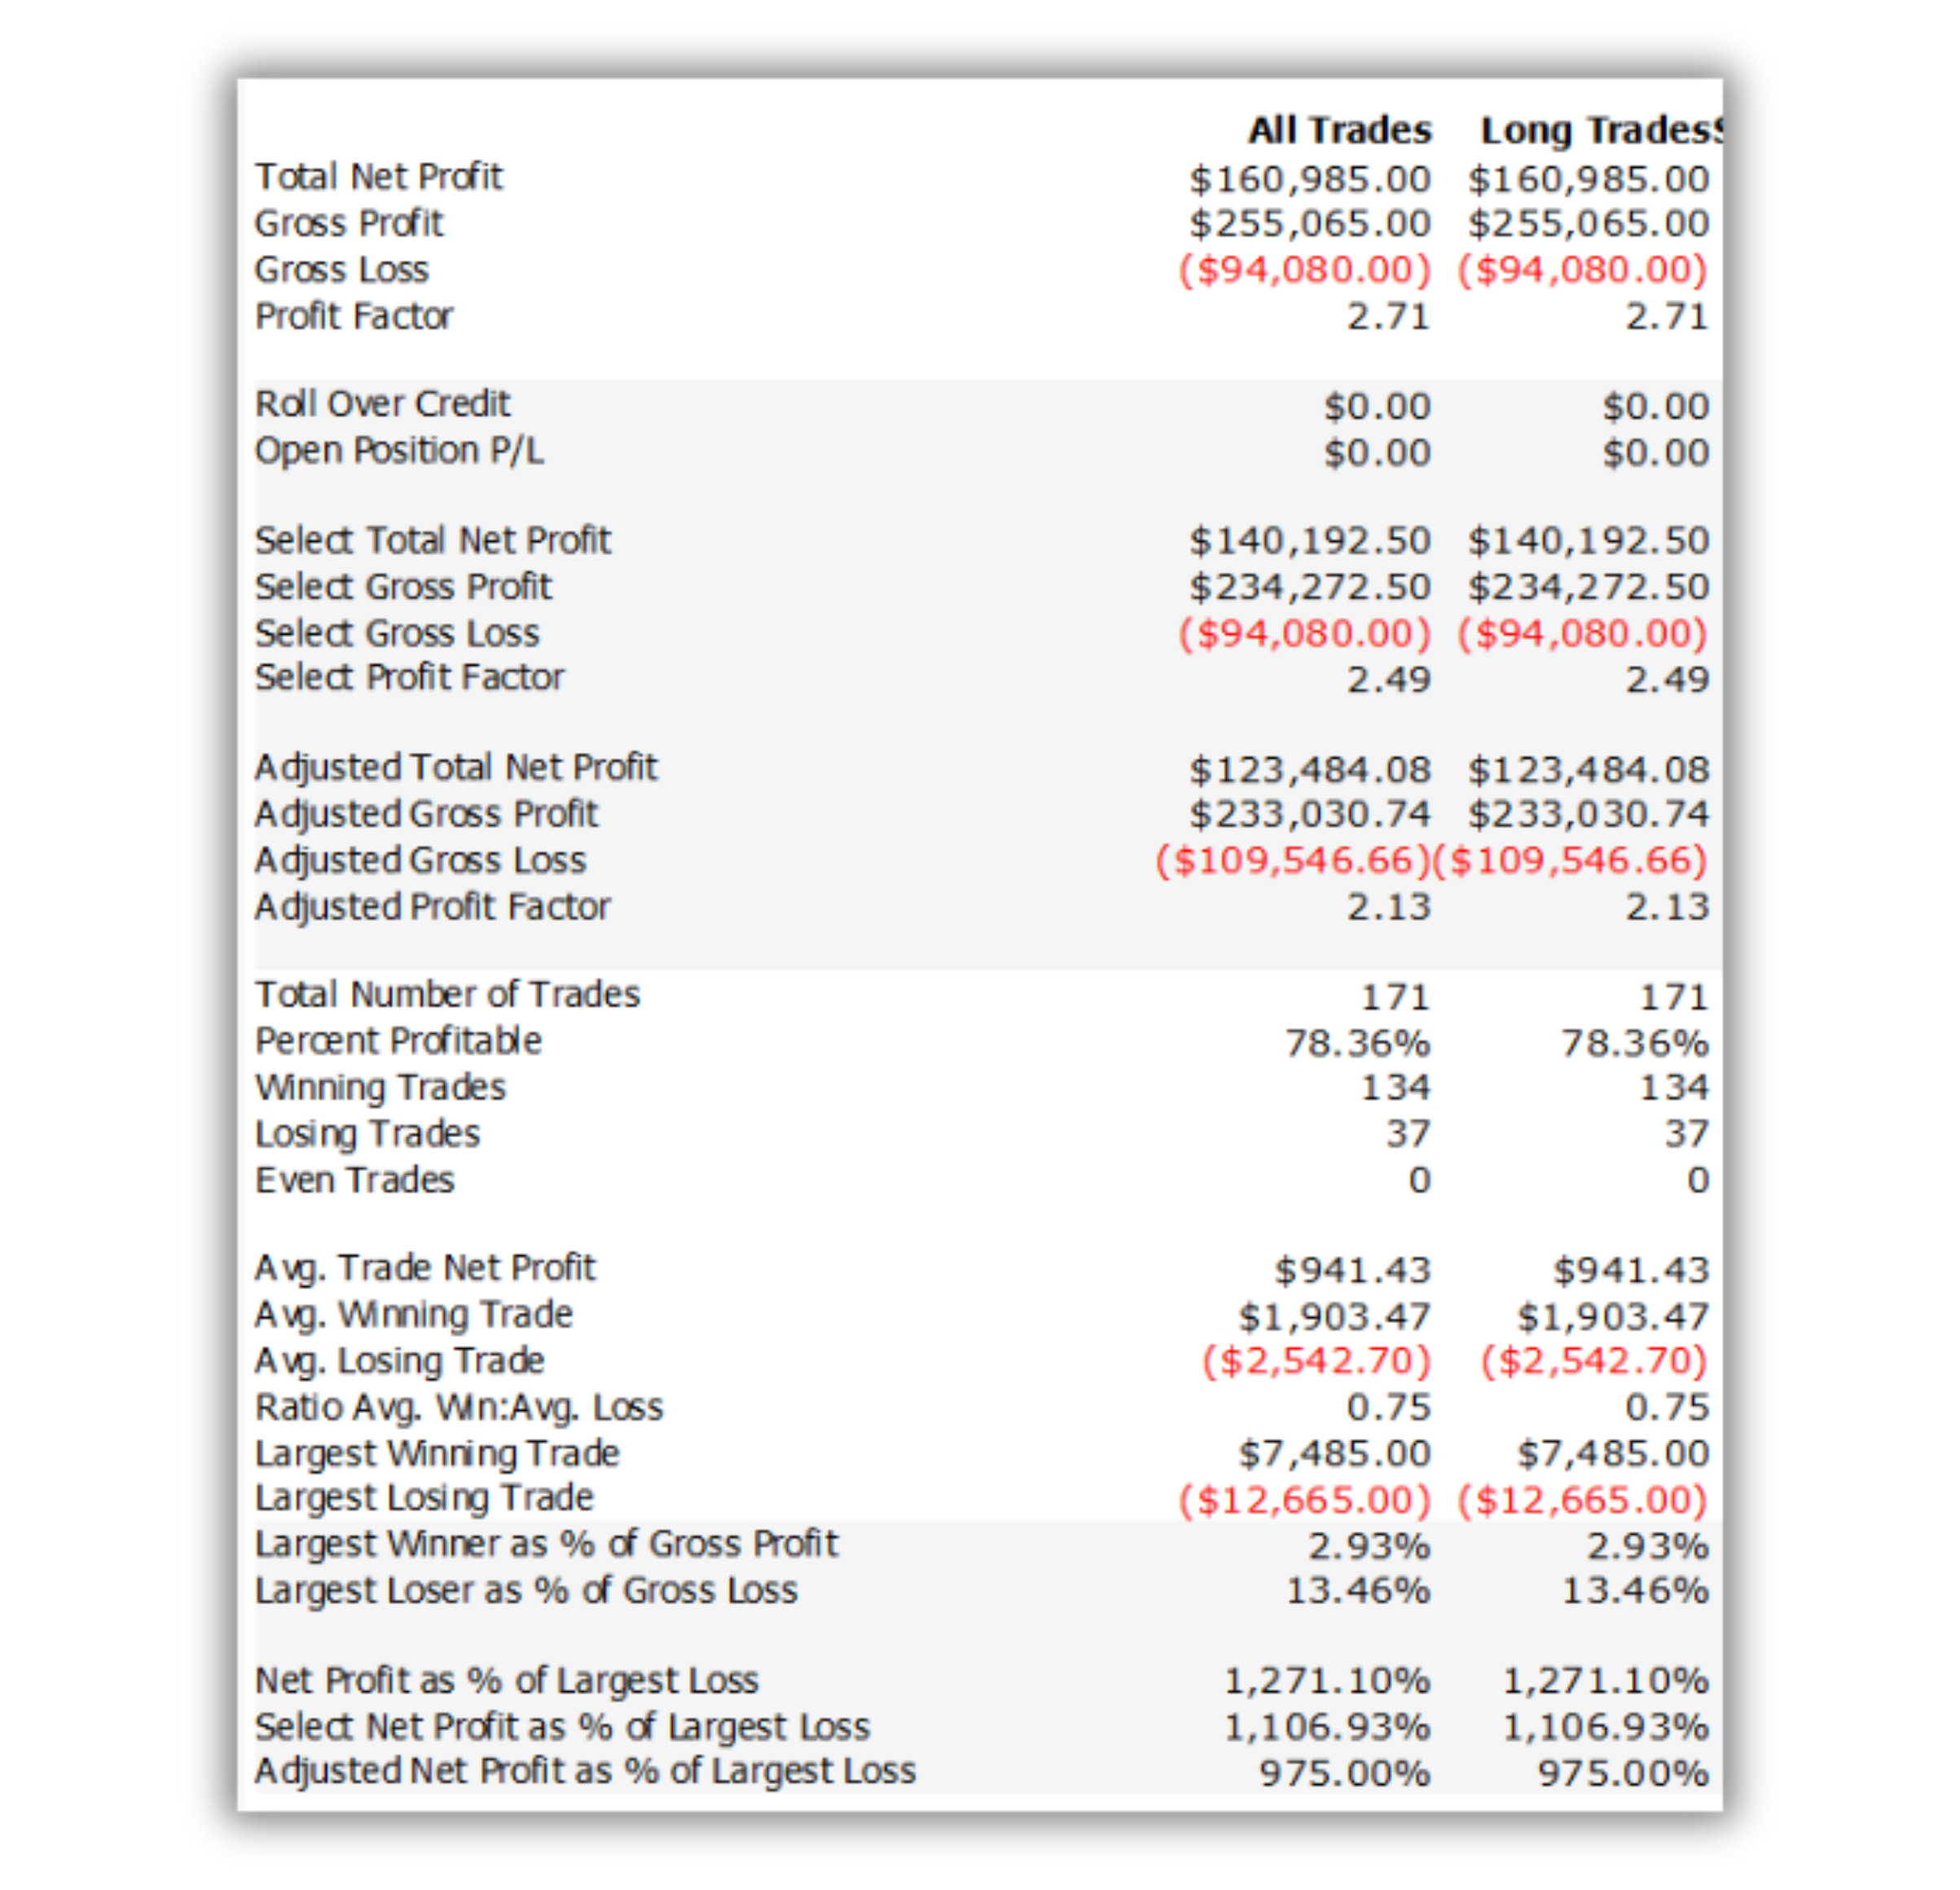
Total Net Profit: $160,985
Profit Factor: 2.71
Trades: 171
Win Rate: 78.36%
Avg Win / Avg Loss: $1,903 / $2,543 = 0.75:1
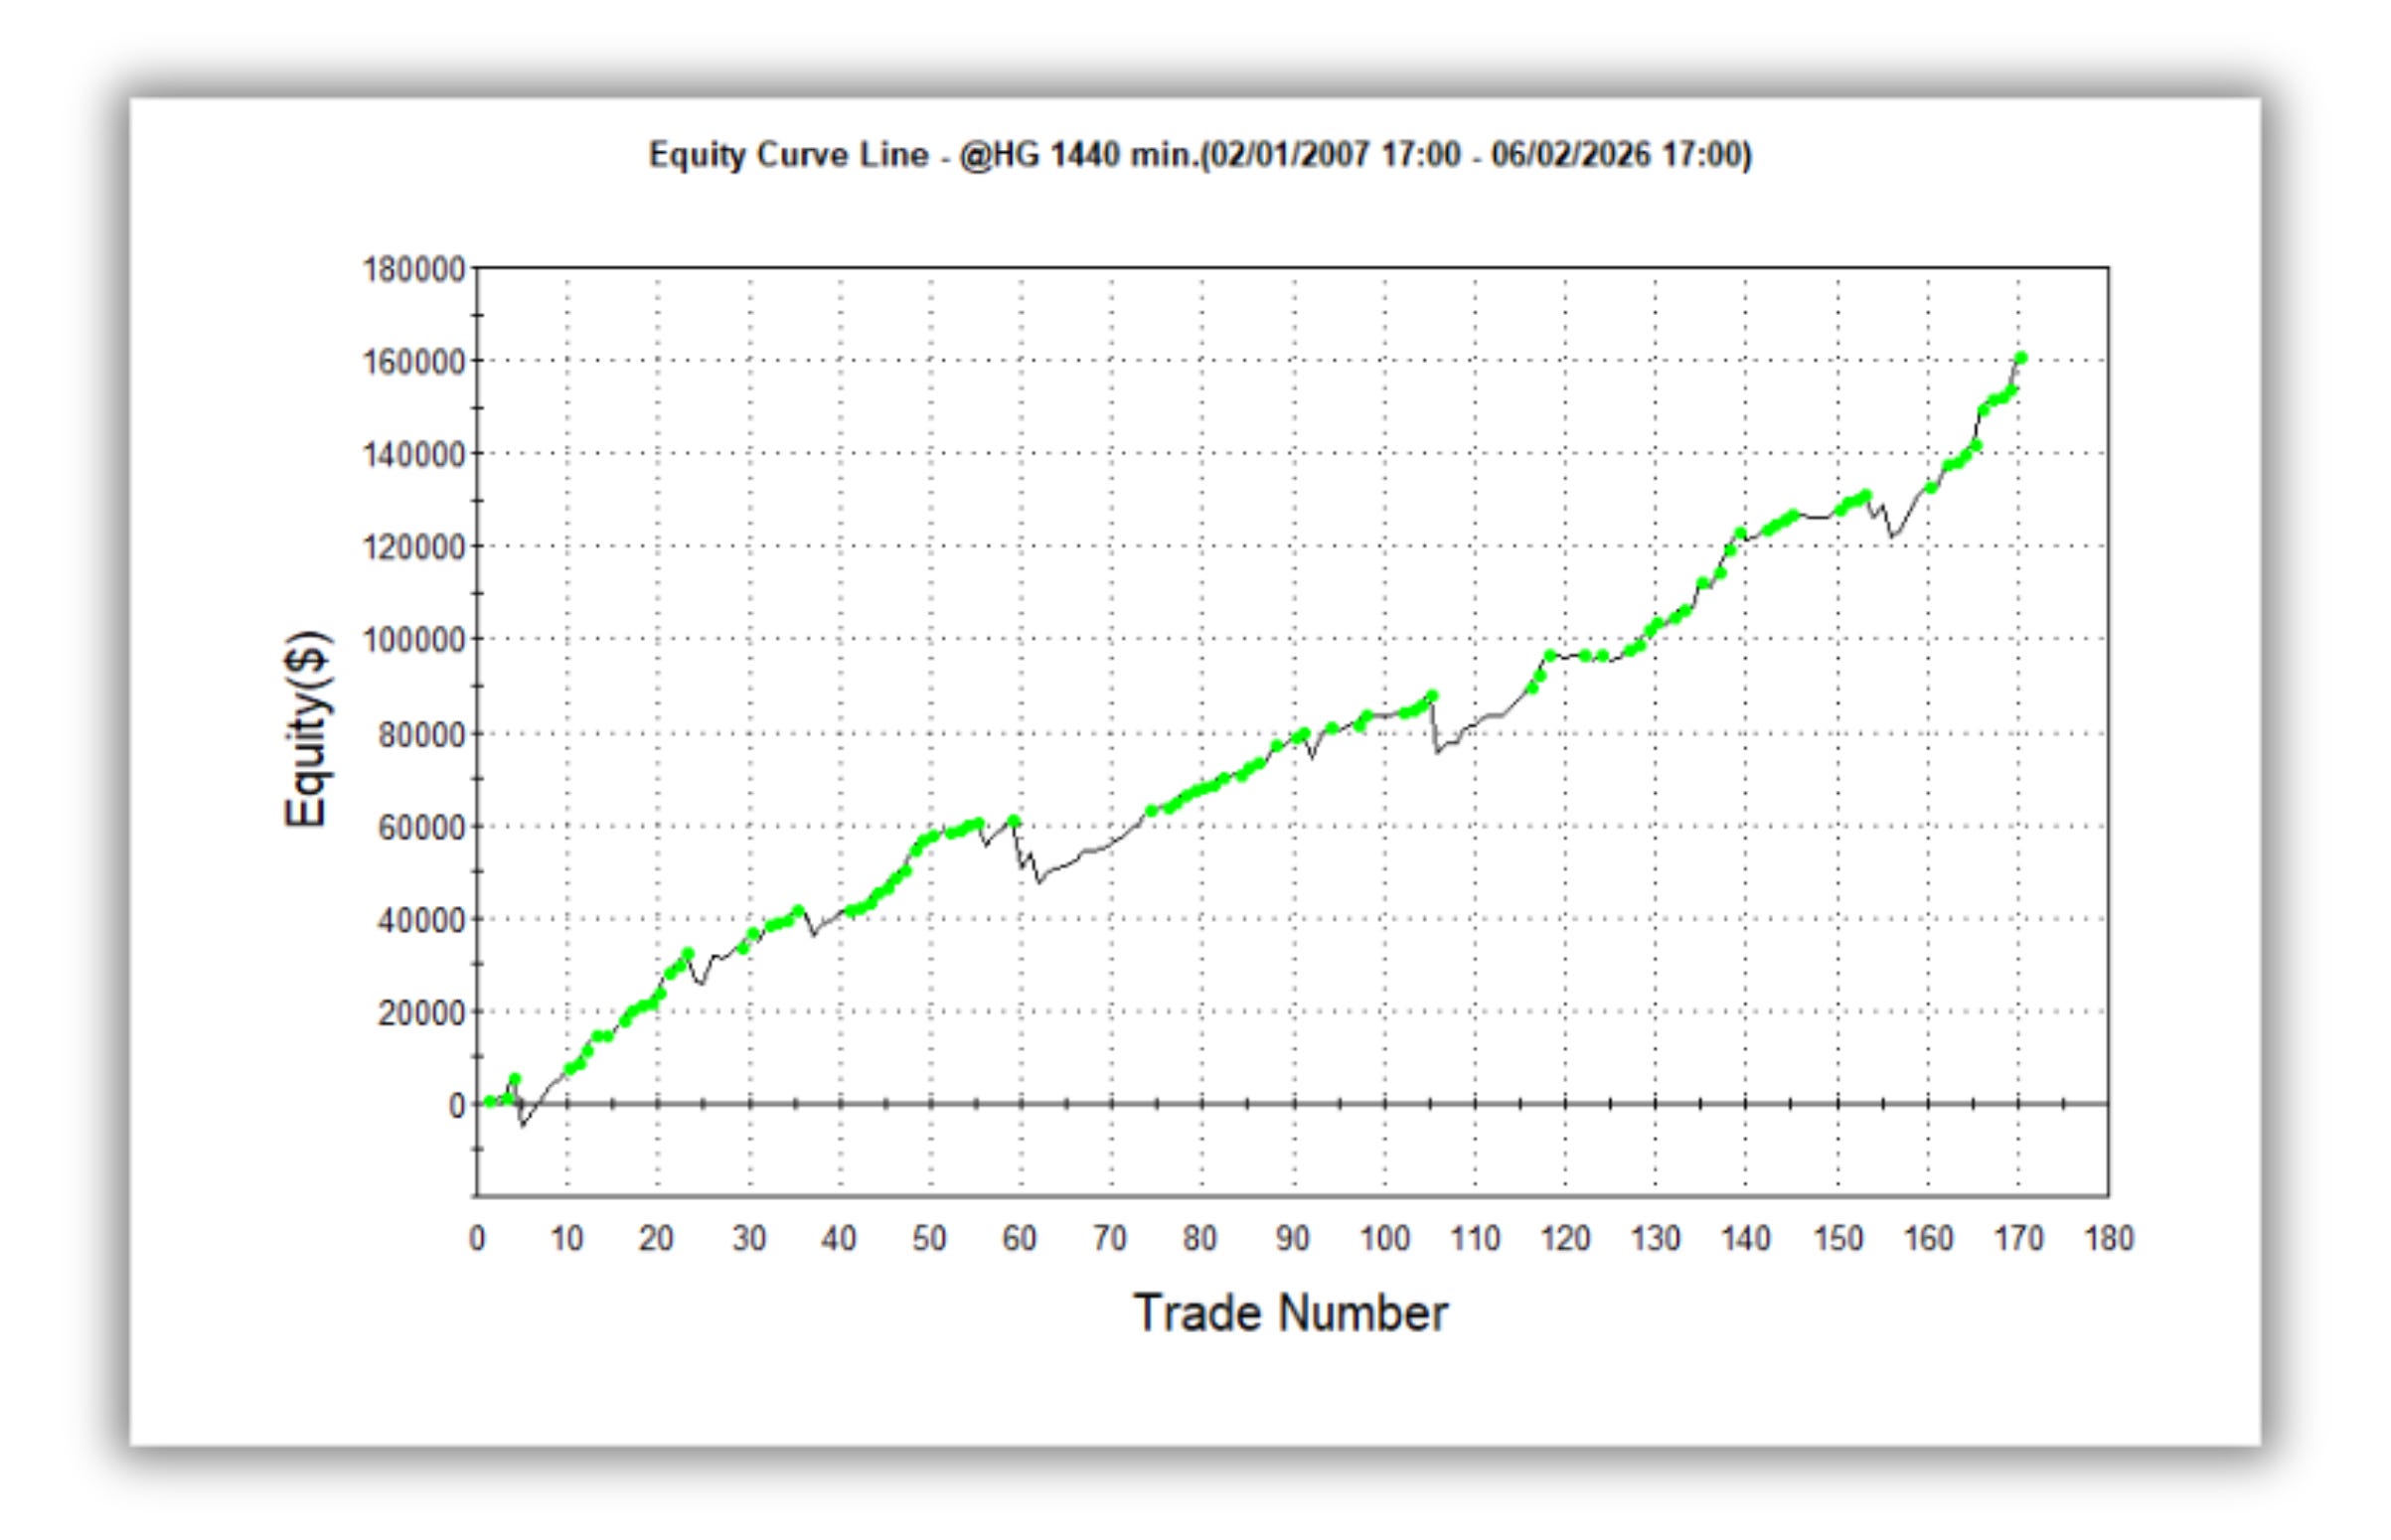
Max Drawdown (intraday): $25,552.50 (25.55%)
Max Drawdown (trade close): $14,107.50 (14.11%)
The equity curve isn’t perfect and that’s a good sign because there is no perfect equity curve without overfitting.
Now here’s the year-by-year breakdown:
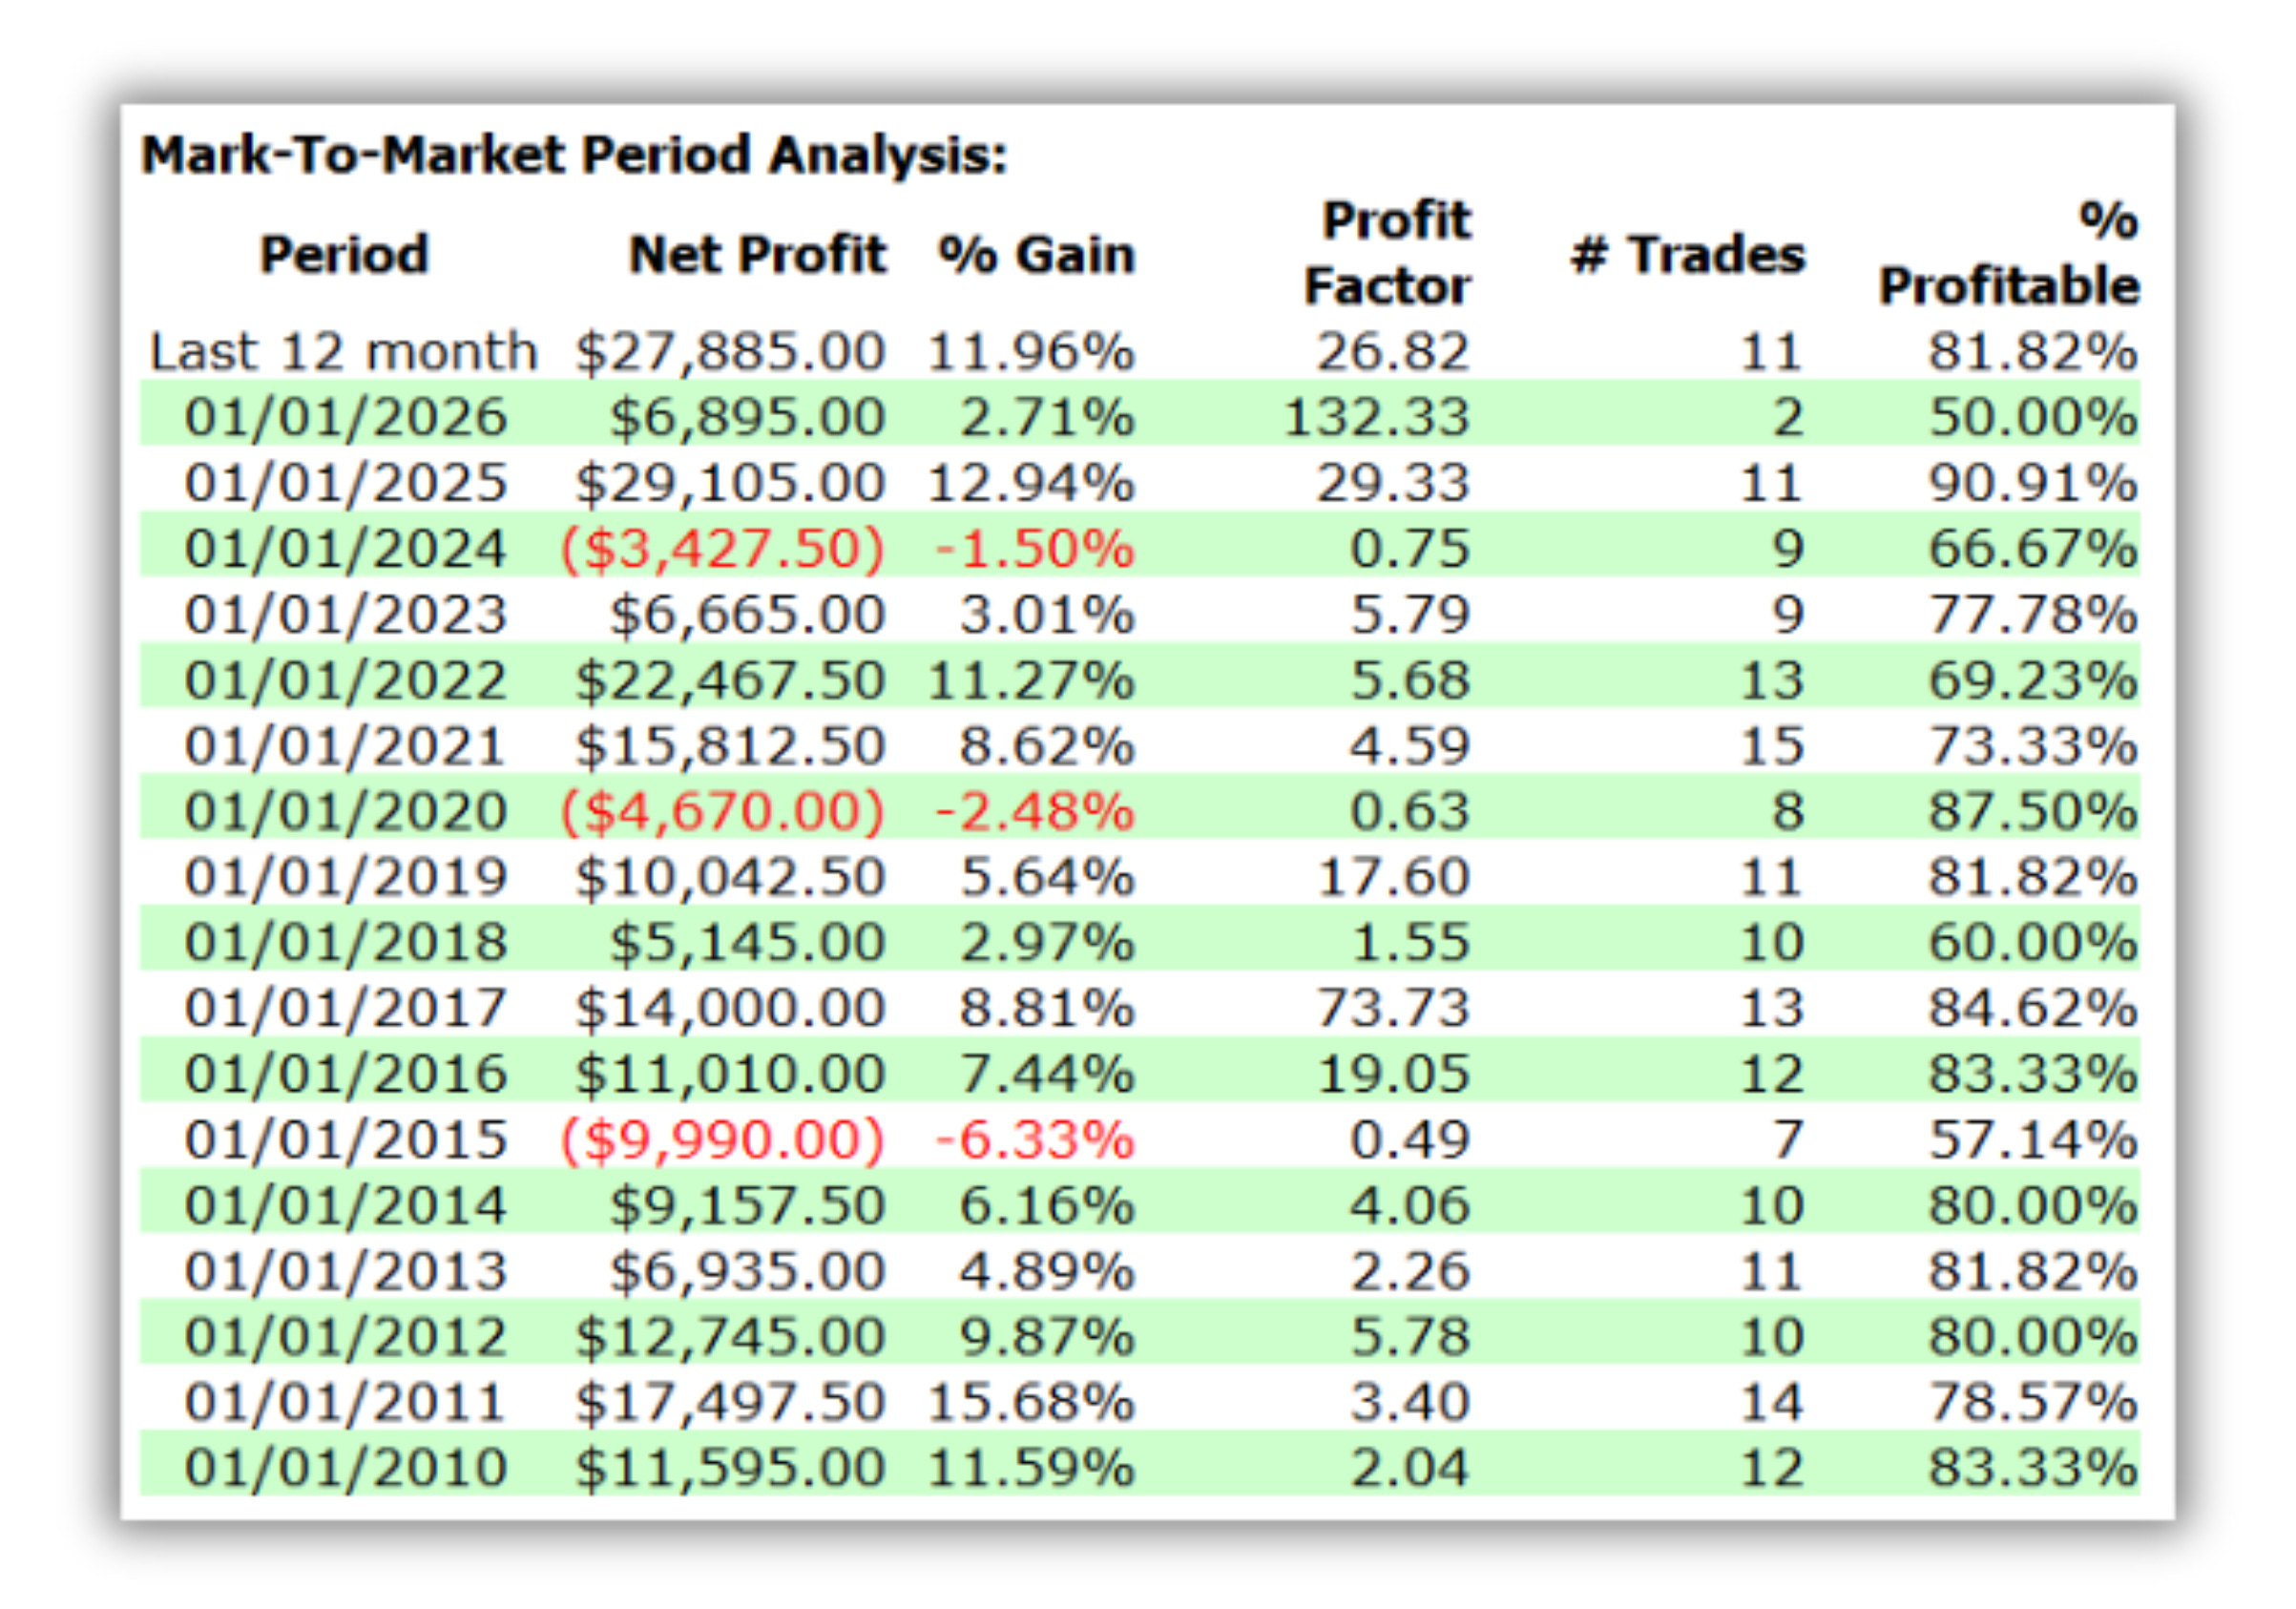
Profitable in 13 out of 16 years.

So Why Does the “Wrong” Filter Work Better?
Honest answer? I’m not 100% sure.
But I have a theory.
Most false breakouts come with a spike of rising momentum. Big bar, big move, everyone jumps in and then it reverses.
When you filter for declining momentum, you skip those traps automatically.
You’re left with the quiet breakouts. The ones that don’t look exciting. The ones nobody tweets about.
And those tend to be really good ones.
That’s my theory. Could be wrong. Could be something else entirely.
But 171 trades, 78% win rate, 16 years of data… the filter is catching something.

You can’t trade a theory
Up to here, you’ve got the idea:
Buy the breakout… when short-term momentum is fading.
But you can’t trade an idea.
You trade rules.
And in this case, the edge isn’t “breakouts” in general.
It’s the exact way the system:
defines compression
recognizes a momentum fade
avoids the classic breakout trap
and exits without getting chopped to death
That’s what’s below the paywall.
Here’s what I’m sharing in the paid section:
How I define “volatility compression” in a way that doesn’t rely on fancy indicators (and why most breakout traders measure the wrong thing).
What “declining momentum” actually means in this system (it’s not “bearish”… it’s something more specific).
Why this filter automatically skips the breakouts everyone loves (the loud ones) and focuses on the ones that actually follow through (the quiet ones).
The reason I keep the entry boring on purpose (because “smart entries” are how good backtests turn into bad live trading).
The test I ran to make sure I wasn’t fooling myself (because yes, counterintuitive filters are where overfitting loves to hide).
Where the edge really comes from — compression, momentum fade, or the exit structure — and the experiment that isolates it.

If you’ve ever built breakout systems and thought:
“Why do I always catch the hype bars… and miss the real trend?”
…this is the antidote.
