
The Market Doesn't Take Vacations (CoT Update)
But I did and this happened...

“Markets are never wrong; opinions often are.” — Jesse Livermore
I took eighteen days off. The market took none.
And when I pulled the positioning tape, I found two markets running in opposite directions inside the same three weeks.
Numbers first, story second, let’s dive in…
What actually happened
The window is June 15 through this week’s close. Positioning runs through the CFTC report of Tuesday, July 7.
One note on method, once, so the rest reads clean: every positioning claim below compares today’s reading against every week of the past three years.
When I say a group is “near a three-year high,” that’s exactly what it means, almost no week in three years shows them more committed than right now.
Here’s the split:
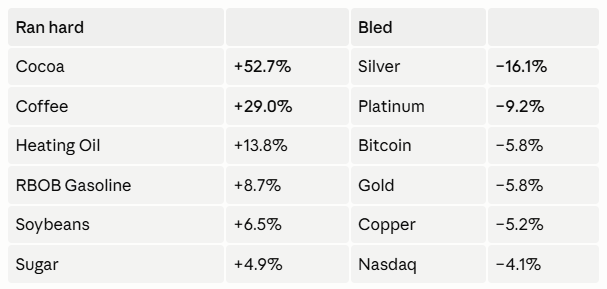
The softs and refined-energy crack went vertical while the precious metals got taken behind the barn at the same time.
The softs: loaded, then booked
The cleanest signal in the report, and it played out entirely while I was gone.
In mid-June, the physical coffee crowd — the roasters and merchants who actually move the beans — was holding one of its biggest long positions of the past three years.
Only a handful of weeks in that entire stretch show them more committed.
Then coffee ran +29%. And they sold into it… steadily, week after week, unwinding a big chunk of that position as price climbed.
The physical crowd loads up at the lows, rides the move, and hands it off into strength.
Cocoa, same story.
The physical players came into the window comfortably long and trimmed the whole way up while cocoa went +53% and roughly +95% over three months. No, not a typo btw.
Cocoa nearly doubled in a quarter.
Metals: same setup, opposite result
The physical crowd was even more committed in metals than in softs and metals did the exact opposite.
Platinum producers spent the entire window at their maximum long of the past three years.
Not near the top but the top.
Silver producers were already close to that ceiling and kept buying as price fell.
Gold producers, same neighborhood.
And silver dropped 16%. Platinum 9%. Gold 6%.
Why did the identical setup pay in coffee and punish in silver?
One word: dollar.
Real money (aka Asset Managers): pensions, insurers, sovereign wealth funds… spent these three weeks pushing its bet on the US Dollar to a fresh three-year extreme.
They were already near record long some weeks ago.
They’re at the record now, and small traders are crowded in right beside them.
When the biggest, slowest pool of capital on the board leans that hard into the dollar, gold and silver wear it.
The metals commercials aren’t wrong. They’re early I guess…
The biggest move on the board
Not a commodity.
Hedge funds walked out of the Nasdaq.
In mid-June they were comfortably long. Three weeks later they’re nearly flat.
One of their smallest Nasdaq positions of the past three years. And who was standing there catching it?
Real money.
The pensions and insurers went the other way, taking their Nasdaq stake from below its usual size to comfortably above it, buying while the index fell 4%.
Read that as a sentence: the fast money bolted, the slow money bought their shares, and the S&P is sitting a whisper from the top of its three-year range while they argue.
One of these camps is about to be wrong.
And there’s a tell in the same neighborhood: hedge funds are now holding close to their biggest stack of volatility insurance in three years, while real money is carrying almost none.
The fast money is paying up for protection. The slow money isn’t.
File that.
The rest, fast
The 10-Year Treasury. Real money has spent over a month hugging its biggest long position of the past three years, the conviction that yields are heading lower simply won’t quit.
Meanwhile they’ve been backing away from the 30-year.
That’s not a broad bond bet; that’s a surgical one. If yields break lower, this is the trade that pays first.
Bitcoin. Fell 6% to around $62,700.
Real money spent the whole window where it’s been all year: effectively absent, the smallest exposure on their books in three years.
Hedge funds sit near their maximum long, wearing every dollar of the decline. The loudest signal in the Bitcoin data is the money that refuses to show up.
Crude. Went nowhere most of the window. Hedge funds cut their crude bet toward the low end of its three-year range, even as the physical crowd stayed at its maximum long, and price only found a bid in the final days.
I’d want another report before calling that a bottom.
The cross-market read
Three weeks, two markets.
The softs and refined energy ran, and the physical players who were maxed out long in mid-June sold into the strength and booked it, a clean, honest signal that did its job.
The precious metals ran the identical playbook and got punished, because real money leaned into the dollar to a three-year extreme and pinned them down.
What I’m watching now that I’m back:
Whether the softs commercials are done selling. They cashed most of the coffee and cocoa move. When the physical crowd stops being max-long, the fuel that carried the rally is gone.
The dollar. It’s the single variable between the metals commercials and a payoff. The slow money’s dollar bet is at a three-year record, a very crowded boat.
The Nasdaq handoff. Hedge funds don’t unload a position that fast for no reason. Someone bought a dip; someone got out first.
Let’s see….

Talk soon,
And btw…
If you’re an annual subscriber, you have access to:
CoT Edge — the full positioning board behind this report. Every market I cover, scored and ranked by signal strength, updated each week. The percentile and rate-of-change math I do by hand for this newsletter, done for you across dozens of markets in seconds.
Seasonal Lab — decades of futures price data pre-sliced five ways: average return curves with confidence bands, monthly heatmaps, day-of-week breakdowns, and entry/exit windows ranked by Sharpe. Filter for what’s active right now.
Quant Papers — a curated catalog of academic strategies, replicated. I code the rules from the paper, run the backtest on my data, and record the real metrics — Sharpe, return, drawdown, win rate — next to the paper’s claim. Reference code included on dozens papers. You see which papers hold up and which don’t.
Strategy Audit — drop in a trade list of your strategy and and it runs 28 statistical tests focusing on what kill real-money systems: curve-fitting and bad luck in the trade sequence.
Portfolio Analyst — run your strategies together and see which ones actually pull weight. Leave-One-Out shows the cost of cutting each system. The Diversificator shows where adding more stops helping.
Trading Ideas — every strategy I’ve published, with the EasyLanguage code and TradeStation workspace and a Plain English version ready to download and test on your own data.
Acces it here:
— Leo
The Rogue Quant
Data: CFTC Commitments of Traders, through July 7, 2026. Prices June 15 → July 9–10, 2026 (latest settle per contract). Positioning compared against a rolling three-year window.
DISCLAIMER: This information is provided for educational and informational purposes only. It is not financial advice, nor a recommendation to buy or sell any securities or financial instruments. Trading involves substantial risk and is not suitable for every investor. You are solely responsible for your own investment decisions and should seek advice from a licensed financial advisor before acting on any information provided in this article. The author(s) and publisher disclaim all liability for any loss or damage arising directly or indirectly from the use of this information. Use this information at your own risk.