The End-of-Month Trading Edge I Discovered During My Morning Walk
How a data mining "accident" led to a 3.34 profit factor strategy that exploits monthly seasonality

One sometimes finds what one is not looking for.
Alexander Fleming
In 1928, Alexander Fleming left his lab messy before going on vacation.
When he returned, mold had contaminated his bacterial cultures.
Most scientists would have thrown it away.
Fleming looked closer.
That "contamination" became penicillin.
Sometimes the best discoveries happen when you're not even looking for them.
And that's exactly what happened to me last week.

What we're going to cover:
1. How I accidentally stumbled on a simple function that revealed real edge (backed by academic research)
2. The process of cleaning up a data-mined strategy into something logical
3. Why end-of-month seasonality makes perfect sense (and the validation that convinced me)
Let's start with how this whole thing happened...
How I Accidentally Stumbled on the TDLM Function
A subscriber asked me for a strategy on interest rates.
I had an idea I wanted to validate.
But before testing that idea, I wanted to see what Build Alpha (BA) could generate...
If you don't know BA…
It's a genetic algorithm that searches through billions of possible combinations - entry signals, price action events, exit criteria, technical indicators, you name it.
Now, I don't use BA to create strategies from scratch, but as an idea generator?
It's incredible.
And that's exactly what I did...
Set the machine running and went for my daily walk after dropping the kids at school.
When I came back, 100+ strategies were waiting...
So here's what Build Alpha gave me...
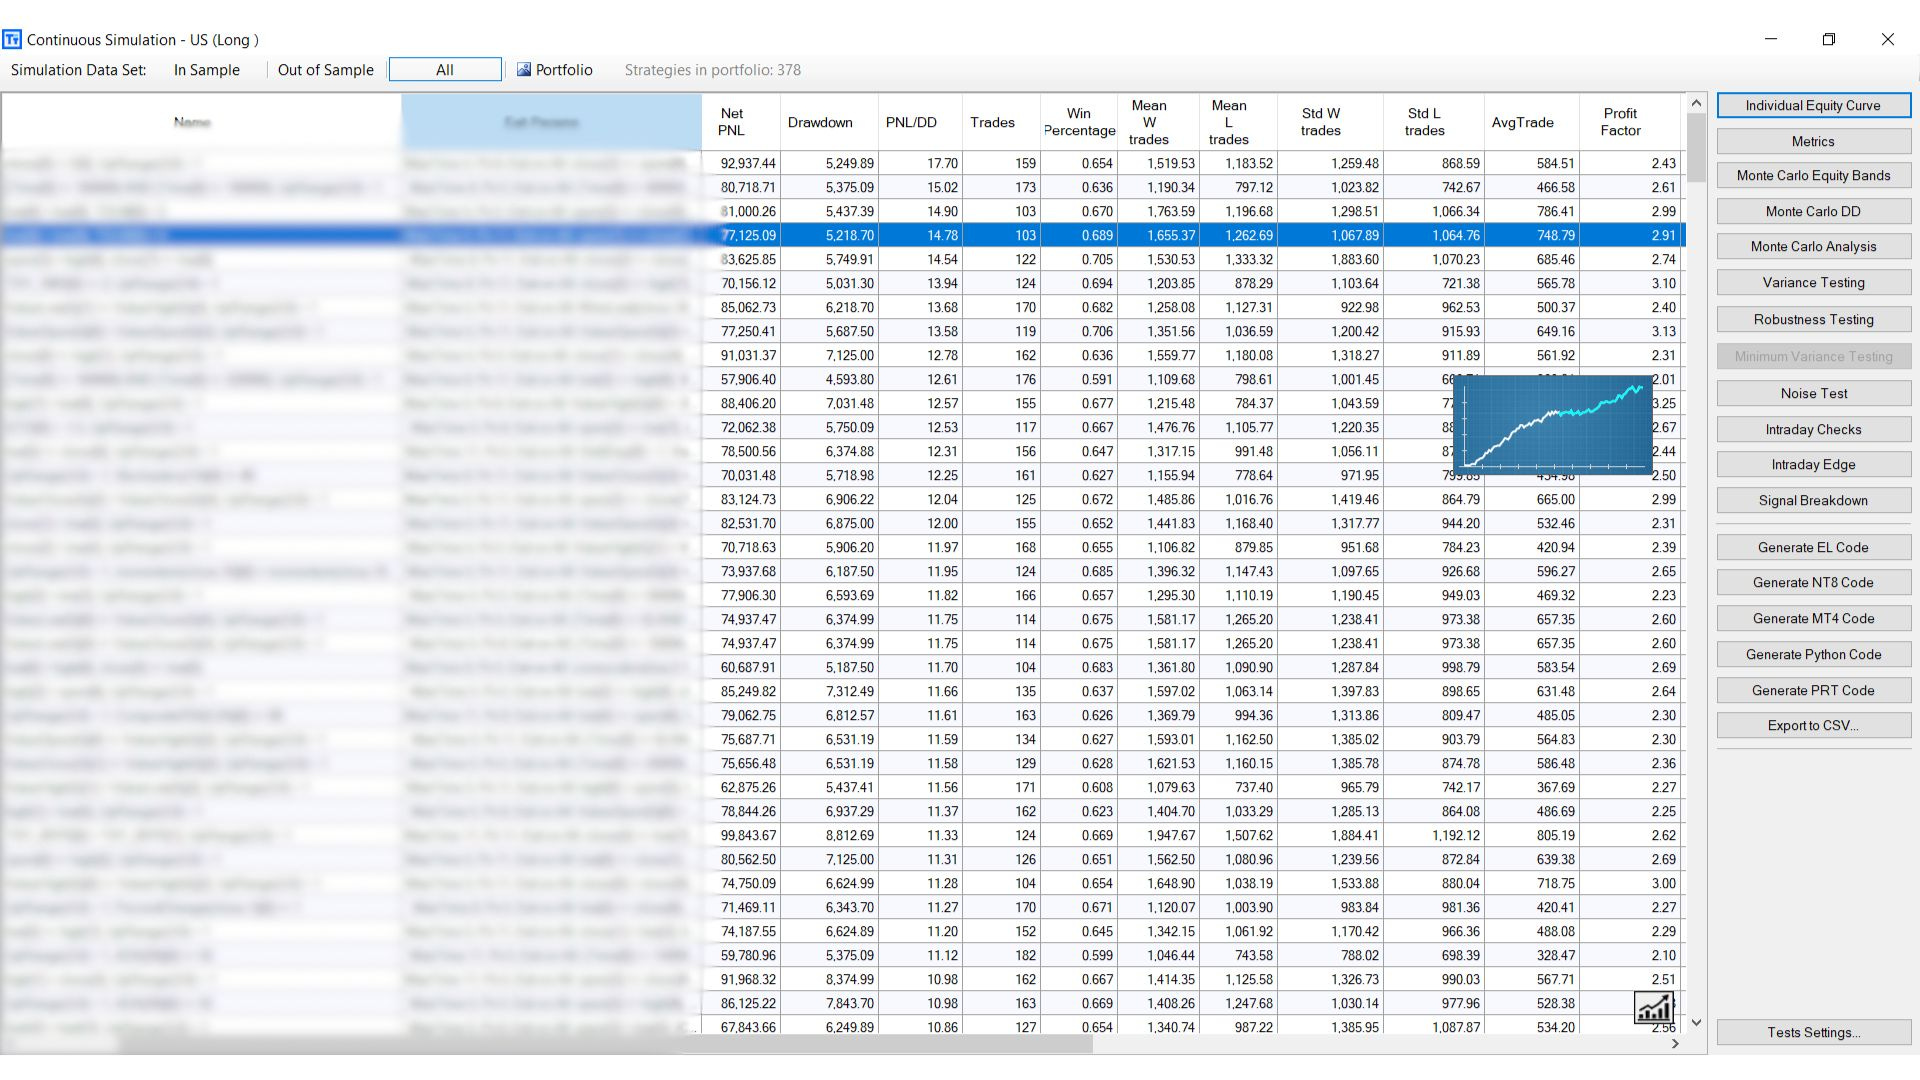
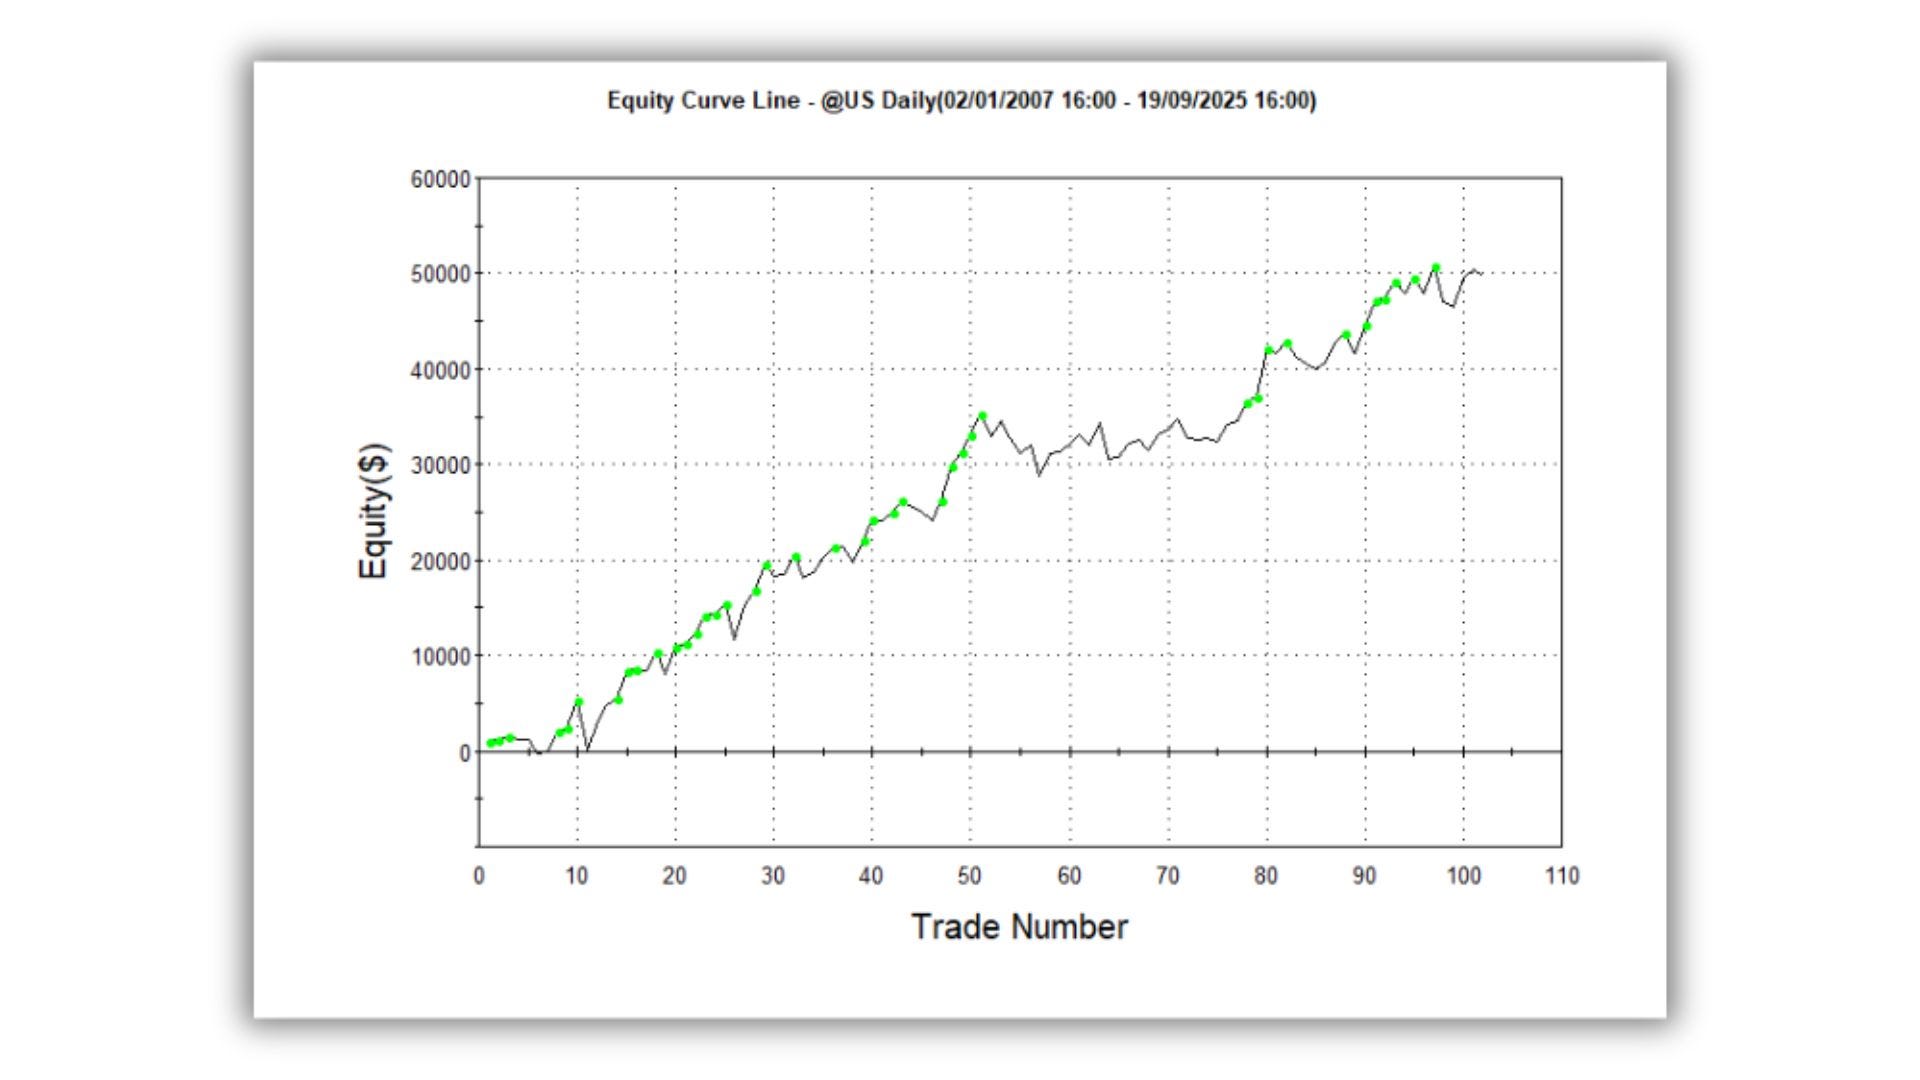
The fourth strategy had this equity curve:
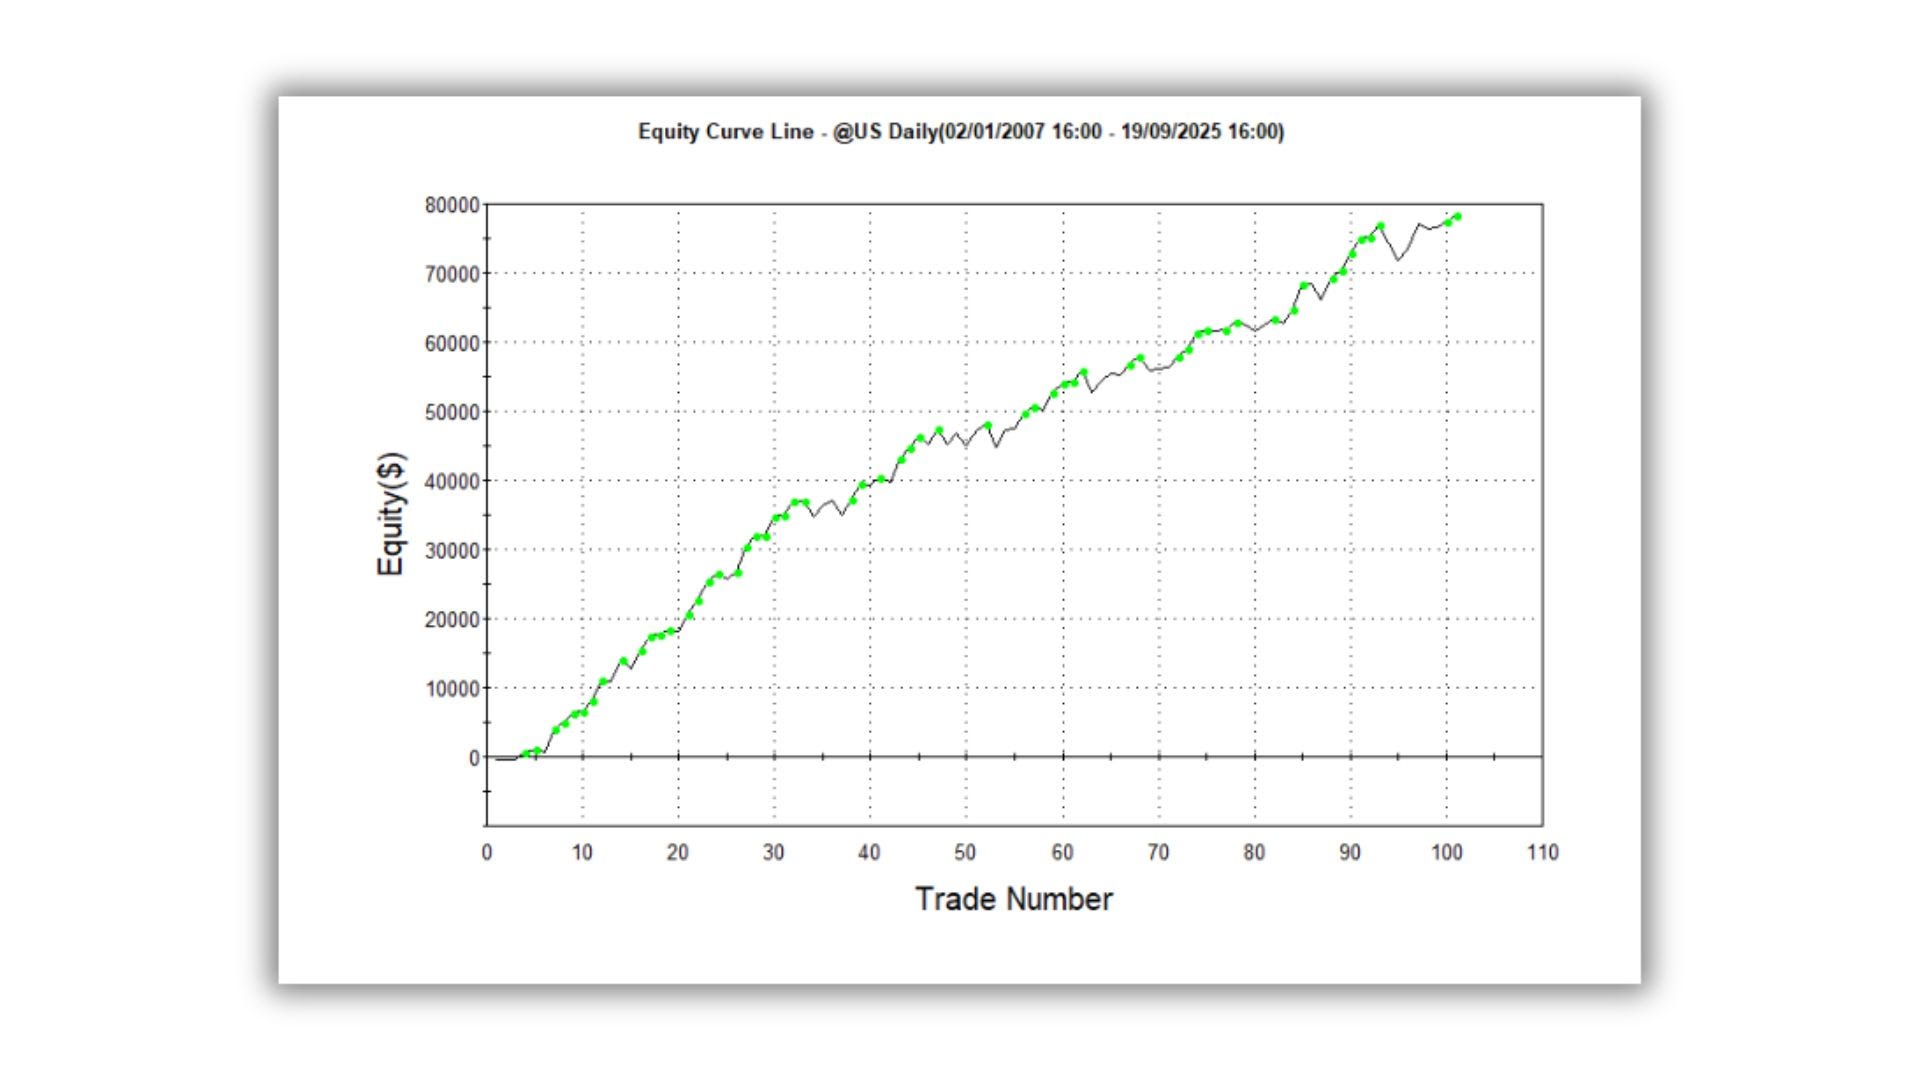
With a 3.3 Profit factor.
And a Max. Drawdown (Intra-day Peak to Valley) of 6.28%.

I'm staring at this thinking...
"How?"
The strategy had only two conditions.
Simple.
Clean.
And absolutely crushing it.
But when I looked at the conditions, one of them made zero sense.
Classic data mining.
The kind of thing that makes you roll your eyes and move on to the next strategy.
But there was something about the other condition...
TDLM
I'd never seen this function before.
So I looked it up…
Trading Days Left Month.

It calculates how many days are left until the month closes.
Wait...
Is there actually an edge in trading the last few days of the month?
I mean, we all know about institutional flows, portfolio rebalancing, month-end effects...
But a 3.3 profit factor just from timing the month-end?
That seemed too good to be true.
And usually, when something seems too good to be true...
It’s not.
But what if…
The Process of Cleaning Up a Data-Mined Strategy
I had to know.
So I did what any rational person (I guess) would do...
I stripped away the nonsense.
Remember that first condition that made no sense?
Gone.
I wanted to test the TDLM logic on its own.
Just pure month-end timing.
No random correlations.
No data mining artifacts.
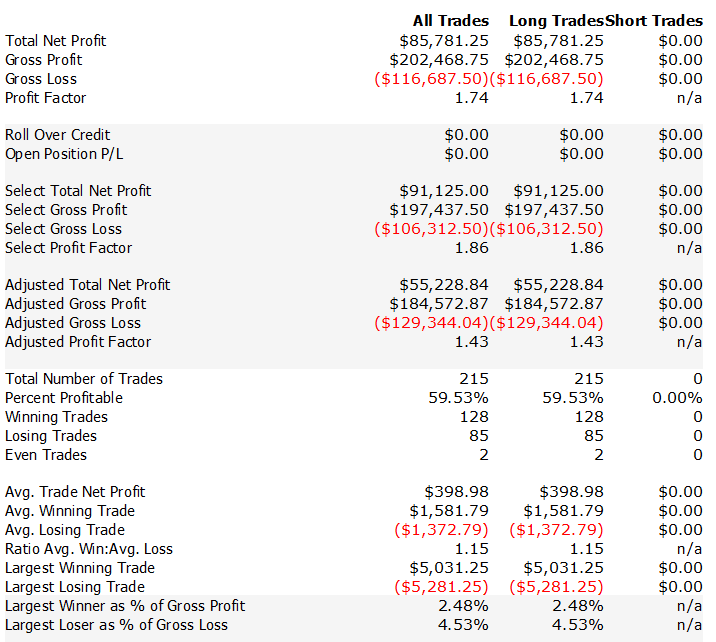
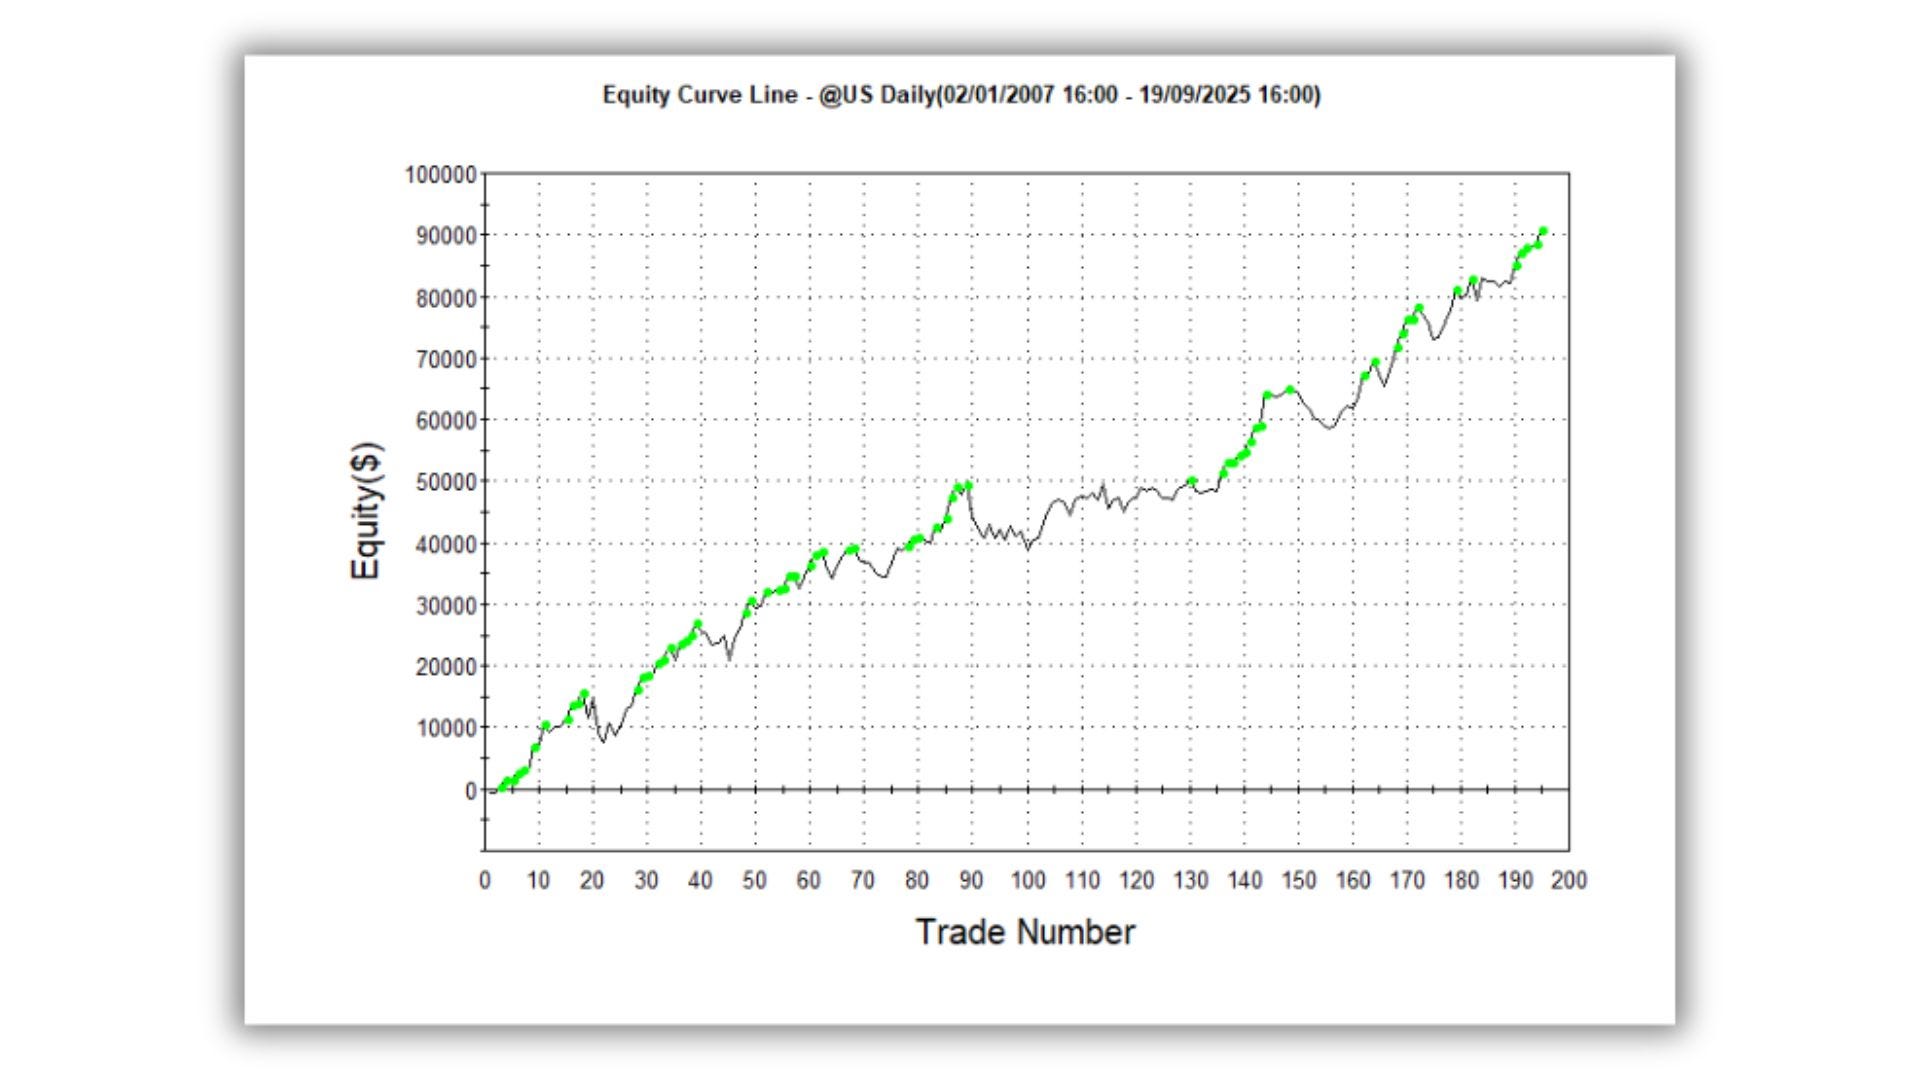
I ran the backtest and that was the result…
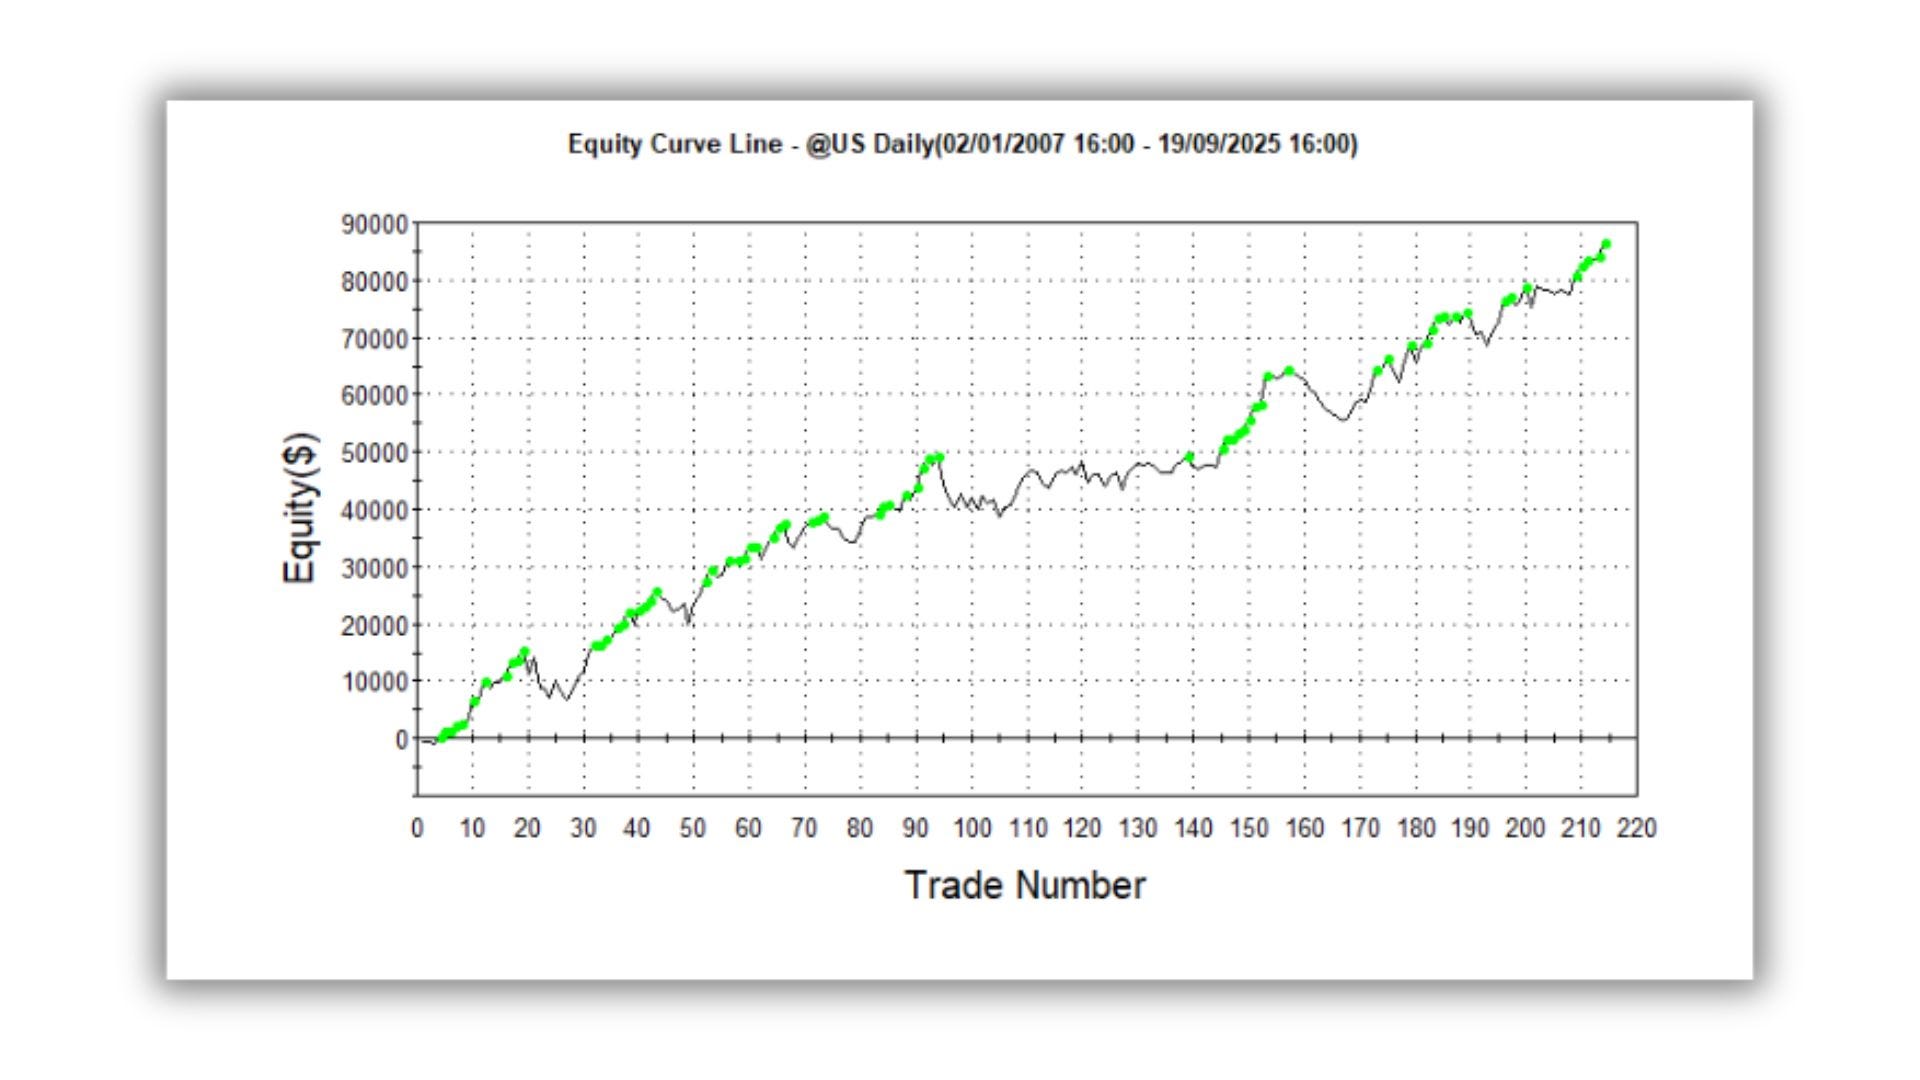
Still positive.
The profit factor dropped to 1.74
But it was still making money look…
That told me something important.
The month-end effect was real.

The other condition seemed to be just noise that the algorithm generated
(And I’ll share what exactly that condition was in a moment with the full code as always…)
But here's what got me thinking...
What was that condition actually trying to capture?
I stared at this for a while.
And then it hit me...
The algorithm was looking for some kind of momentum.
Recent lows being higher than older lows.
It's a clunky way to say "we're in an uptrend."
So I thought...
What if I replace this with something that actually makes sense?
Same concept.
Much cleaner logic.
Way less data-mined.
I coded it up and ran the test...
Profit factor: 1.96
Wait.
That's not just good.
That's incredible.
But I wasn't done yet...
I tried another variation of momentum and…
Same thing.

The logic behind the weird condition works.
But I still had one question nagging at me...
Why does this actually work?
Why End-of-Month Seasonality Makes Perfect Sense
Look, I'm a skeptical guy.
I don't believe in magic.
Or secret patterns that "they" don't want you to know about.
But month-end effects?
Those are real.
And there are solid reasons why...
Portfolio rebalancing.
Think about it.

Institutional investors manage trillions of dollars.
Pension funds, insurance companies, ETFs, mutual funds...
They all rebalance at month-end.
It's not a conspiracy.
It's just how the system works.
And here's the thing...
This effect is getting stronger over time.
The Federal Reserve Bank of New York just published research showing that Treasury trading volume is 33% higher on the last trading day of the month.
33%!
And this pattern barely existed before 2015.
But it's been growing as passive funds exploded in size.
Treasury ETFs alone grew more than ten-fold between 2013 and 2024.
All of these funds rebalance on the same day (or close)…
The last trading day of the month.

But then I remembered that I had recently seen a paper about the end-of-month effect.
And when I searched my trading strategies database, I found...
A Stanford paper called "Predictable End-of-Month Treasury Returns" shows that Treasury securities have positive and highly significant excess returns in the last few days of the month.
The authors found that a long Treasury position for just the last few days of each month gives a Sharpe ratio of around 1.
Just from timing month-end.
This isn't some random pattern I found in my backtest.
This is documented, peer-reviewed research.
And by the way...
That Stanford paper is one of over 130 strategies in my Strategy Bank that I've extracted from academic research.
Because reading through 40-page papers filled with complex formulas and endless regression tables isn't exactly fun (oh did I mention there are no GIFs on academic papers? :))
If you're an annual subscriber, you already have access to the strategy database.
If not, well... maybe it's time to consider upgrading.
But back to the strategy...
So now I had validation from multiple angles.
My own backtest showing consistent results across different parameters.
Federal Reserve research documenting the volume patterns.
Academic papers documenting the anomaly.
The strategy was holding up.
But here's what really convinced me...
The results made intuitive sense.

We're not talking about some mystical pattern that only works because of data mining.
We're talking about institutional flows that happen every single month.
Sometimes the best discoveries happen when you're not even looking for them.
Fleming found penicillin in contaminated cultures.
I found a month-end edge while testing interest rate strategies.
Build Alpha gave me a great trading idea (and btw, if you want to know more about Build Alpha send me a message).
By replacing the weird condition with logical momentum filtering, I had a strategy I could actually trade (but first I’ll monitor it on a live simm account).
Now, I know what you're thinking...
"What's the exact entry condition?"
"How do you calculate that momentum filter?"
"What were the exit rules that got you to 2.0 profit factor?"
"And what was that ridiculous condition Build Alpha originally found?"
Just keep reading and I’ll share the full code…