Six Signals This Year. Three Days Each. $15,190. (CoT Update + Full Trading Strategy)
Long-only crude, 203 trades, profit factor 2.26 and an entry condition that has nothing to do with oil's own positioning…

Two weeks ago I wrote that oil’s biggest bulls had stopped adding to their book, with crude near $90.
You can read it here:

Crude closed Friday at $78.18.
I skipped last week, so this edition covers two CFTC reports.
I’m also going to show you something new at the end of this one:
For the past few days I’ve been building and bakctesting a long-only crude oil strategy that takes its entry signal from CoT positioning (another CoT strategy I know…)
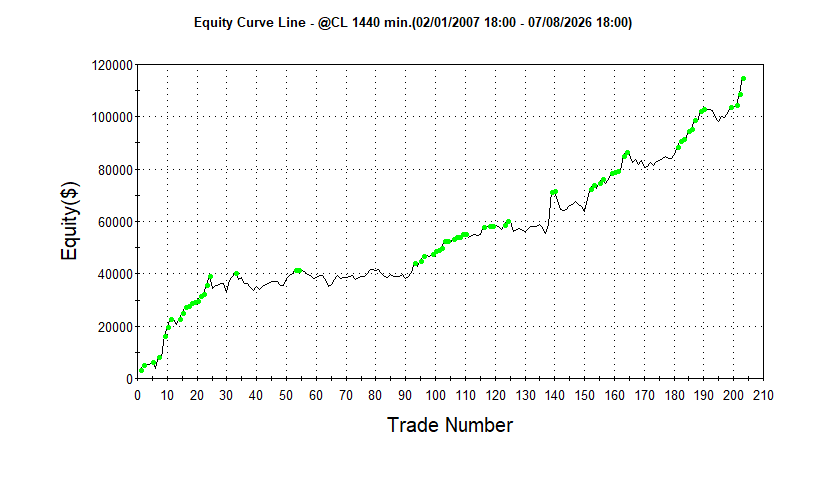
Full results below, including the years it lost money and the drawdown number I don’t love.
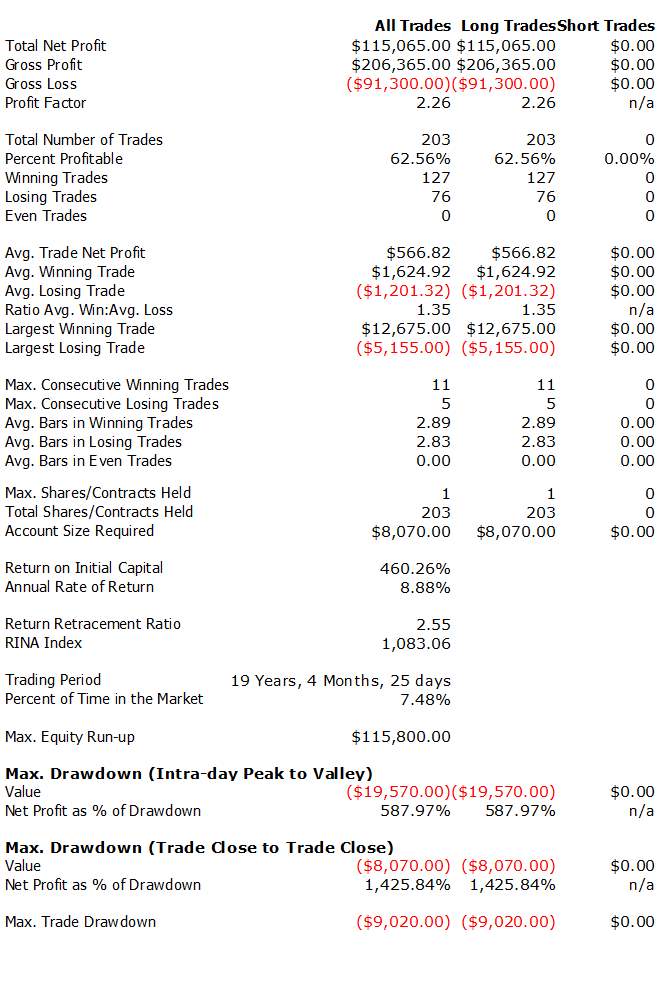
I’ll share the rules and the complete code at the end.
First, the week.
Let’s dive in…
The Week, In One Picture
Positioning runs through Tuesday, August 4.
Prices through Friday, August 7.
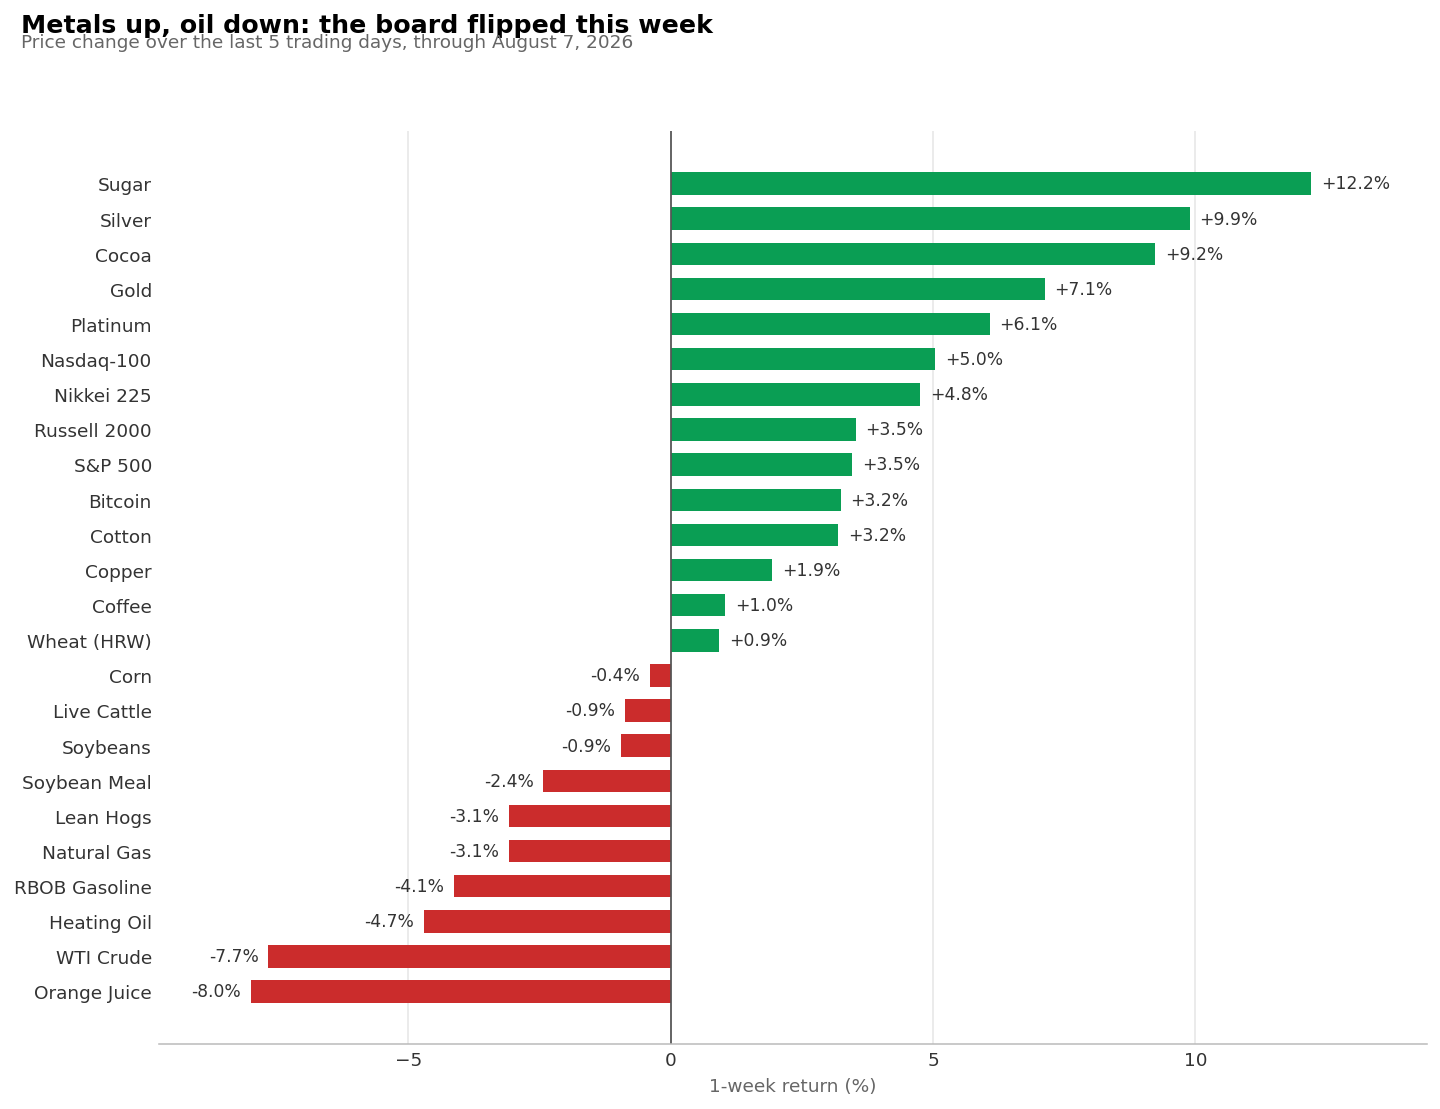
The board flipped.
Crude is second from the bottom at −7.7%, beaten only by orange juice, with heating oil and gasoline right beside it.
Silver, gold and platinum are the ones running (it’s a shame because somehow I missed an entry on Gold at 4,135…)
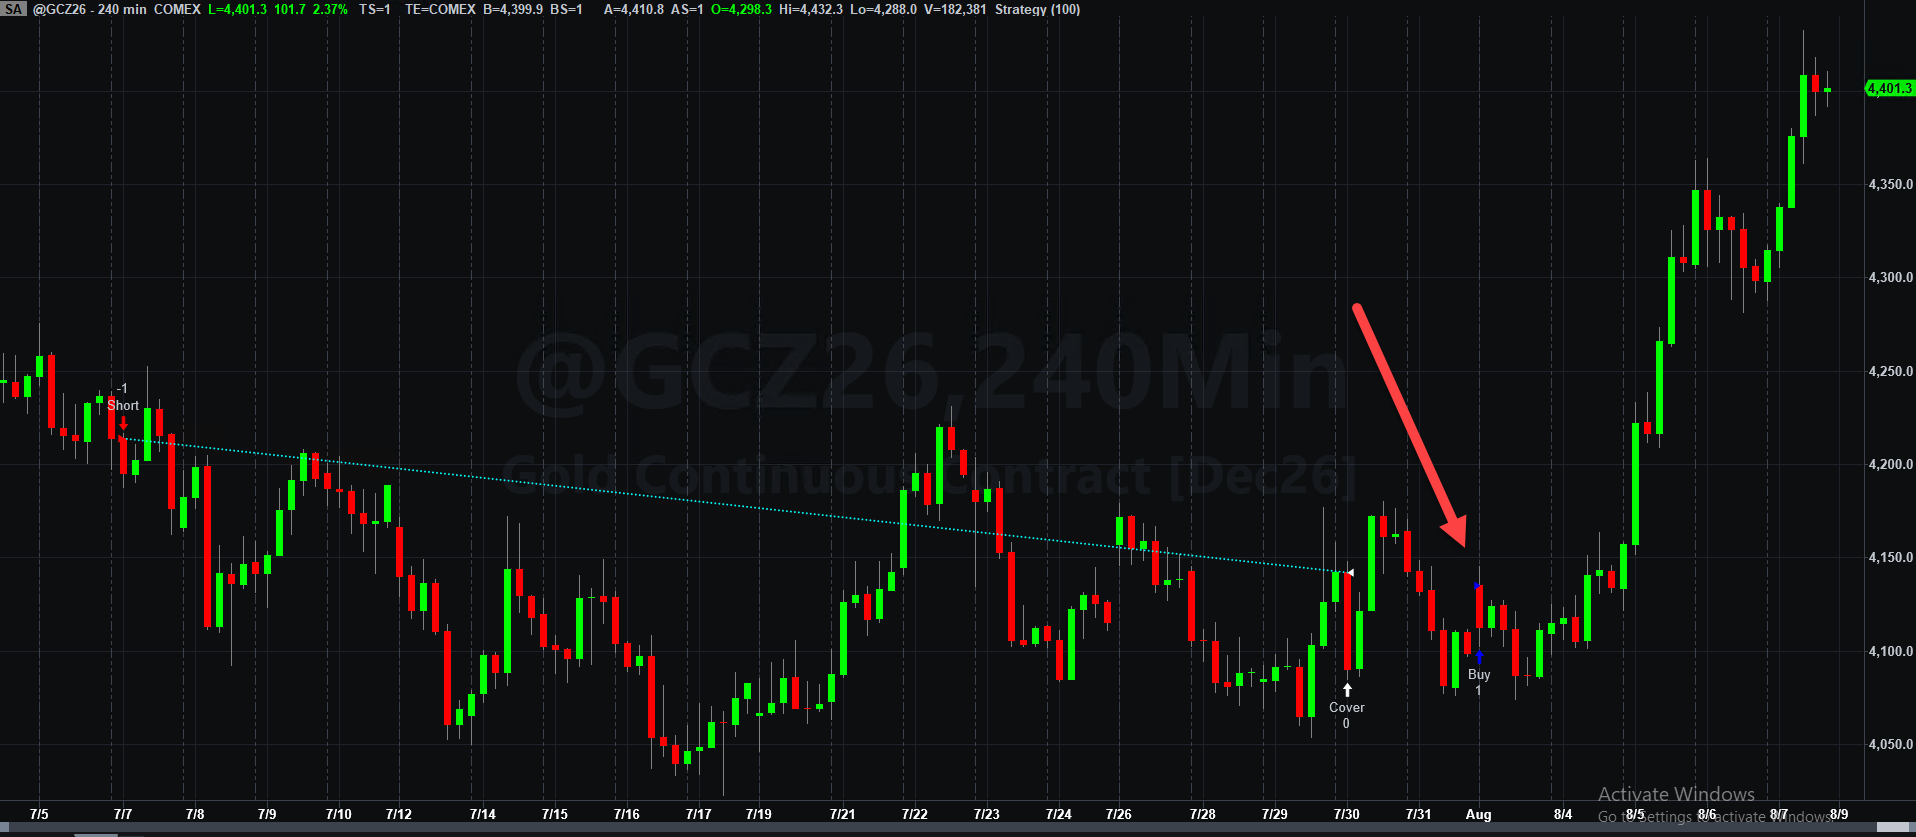
Anyway…
Sugar had the biggest week of all at +12.2%, cocoa bounced 9.2%, and the S&P closed Friday at its highest level in three years.
Who The Blue Line Is
The crude, silver and gold charts show the CFTC’s Producer/Merchant/Processor/User category, the physical crowd, the people who pump it, refine it, or mine it.
In most markets they hedge by selling forward, so their book runs short.
In oil it runs long, because refiners buy forward to lock in supply.
The Nasdaq chart shows Asset Managers: pensions, insurers, sovereign wealth, the real money.
Crude:
Physical players built their crude book to a three-year record on July 14, price confirmed with a 27% run, and then on July 21 the book stopped growing.
That’s the report I wrote up two weeks ago, with crude near $90.
Since then: $92.19 on July 23, $78.18 on Friday. Down about 15% from the high.
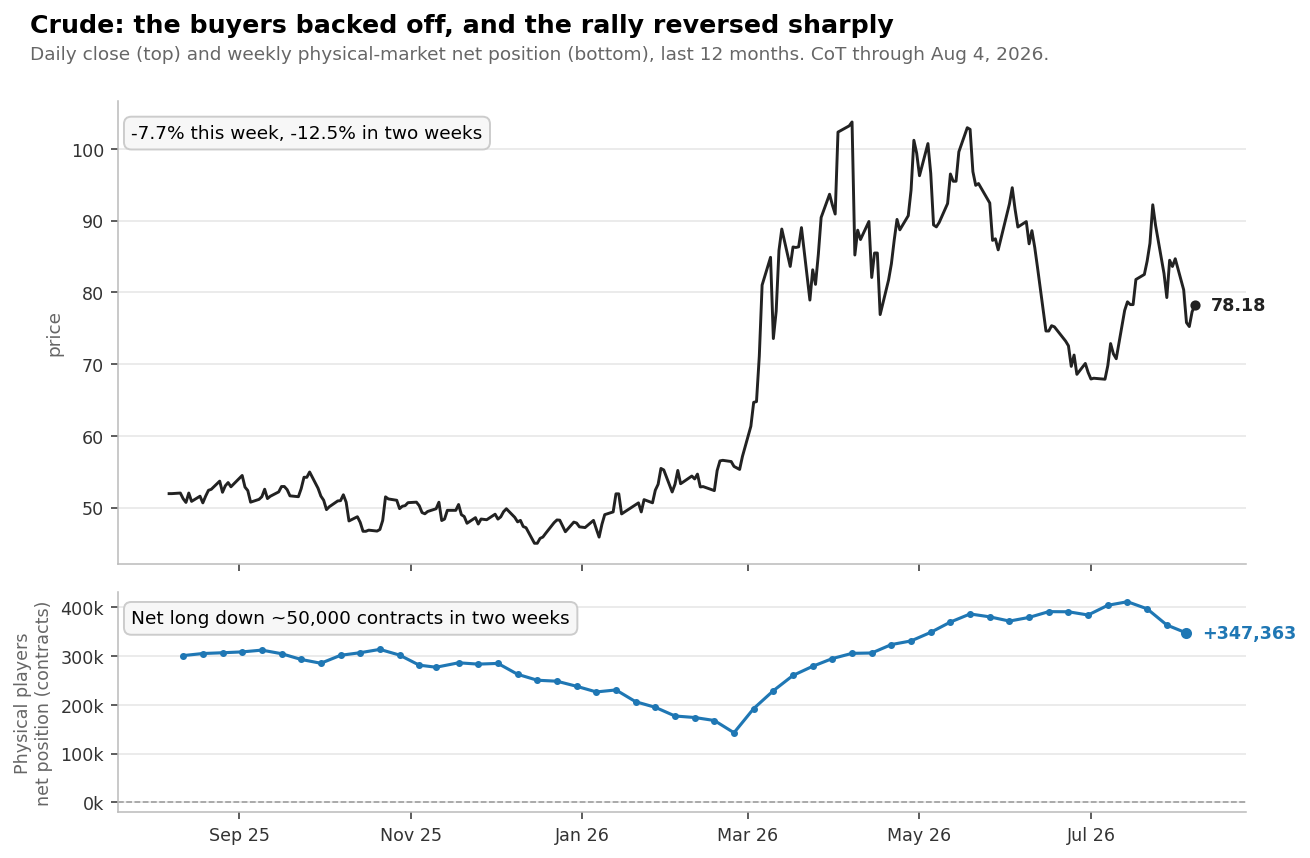
The net long has dropped roughly 50,000 contracts in two weeks.
Longs came down about 32,000 contracts while shorts went up about 18,000 (less buying forward, more selling forward).
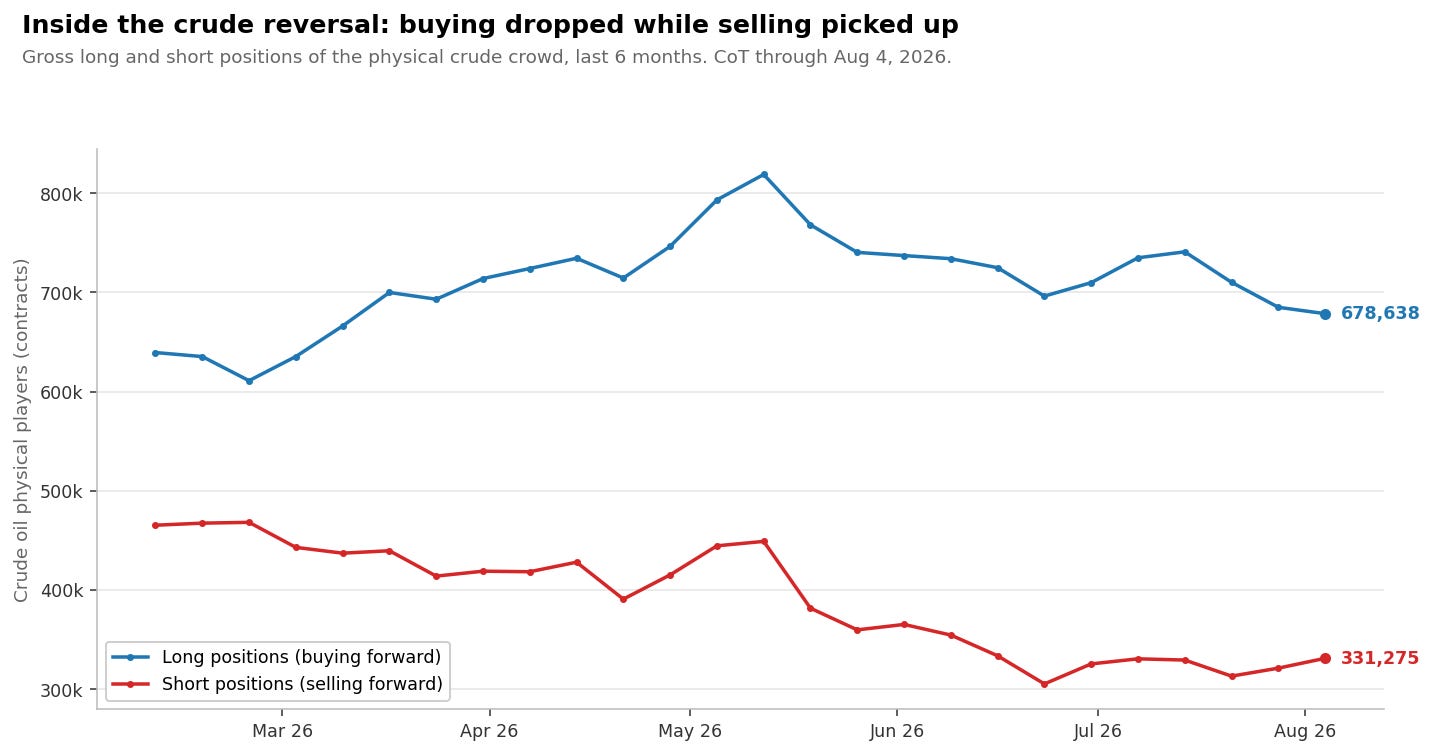
Two weeks ago both sides were shrinking together, which told you participation was thinning and not much else. This is a little different.
Crude traded down to $74.24 intraday Wednesday and closed at $75.22, and has bounced since.
The others products fell with it: heating oil −4.7%, gasoline −4.1%.
Silver And Gold:
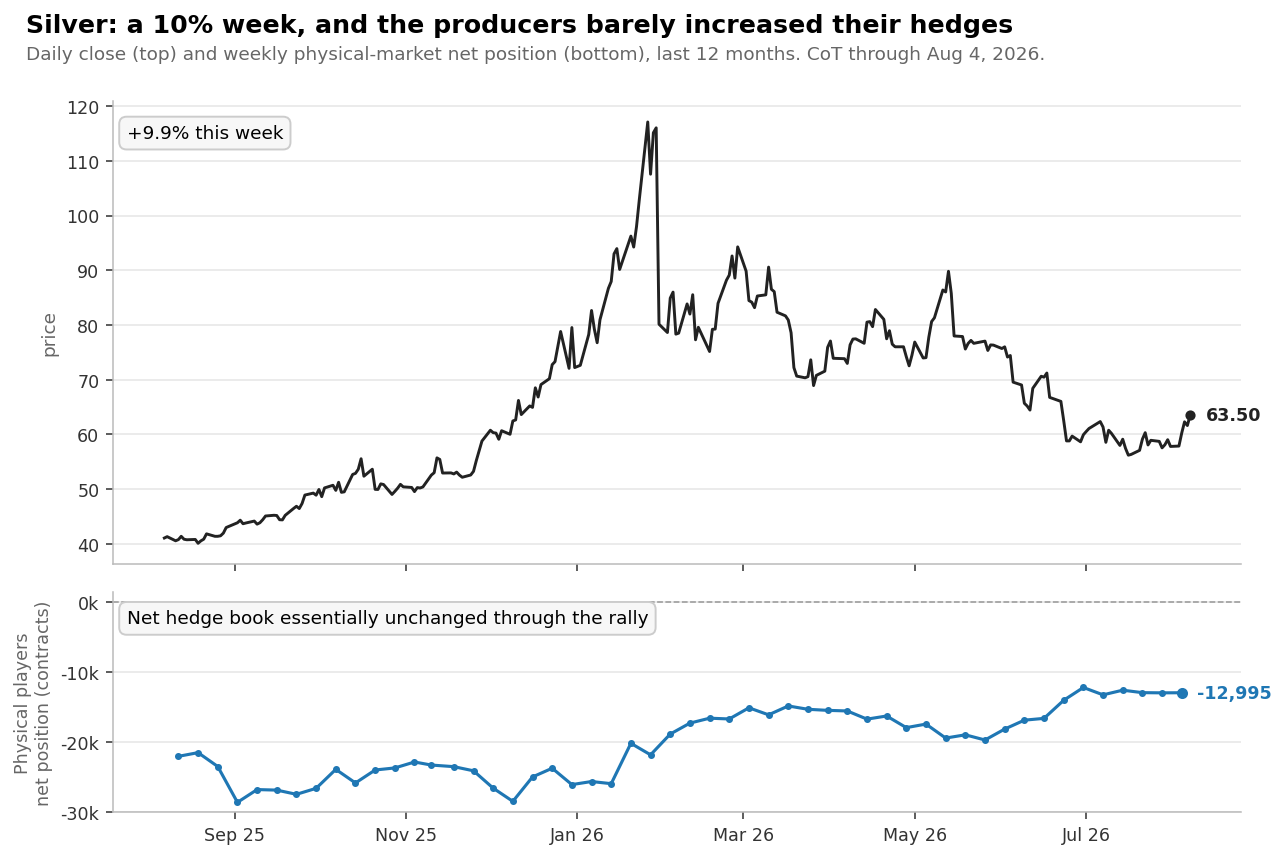
For three straight editions silver was my honest counterexample: best physical-market posture on the board, price falling anyway.
Silver rose 9.9% this week, to $63.50.
Here’s what matters more than the bounce:
The producers did add hedges this week, about 226 short contracts. They also added 241 longs. Net effect: their book moved 15 contracts. Essentially nothing.
That’s the tell.
Gold went further.
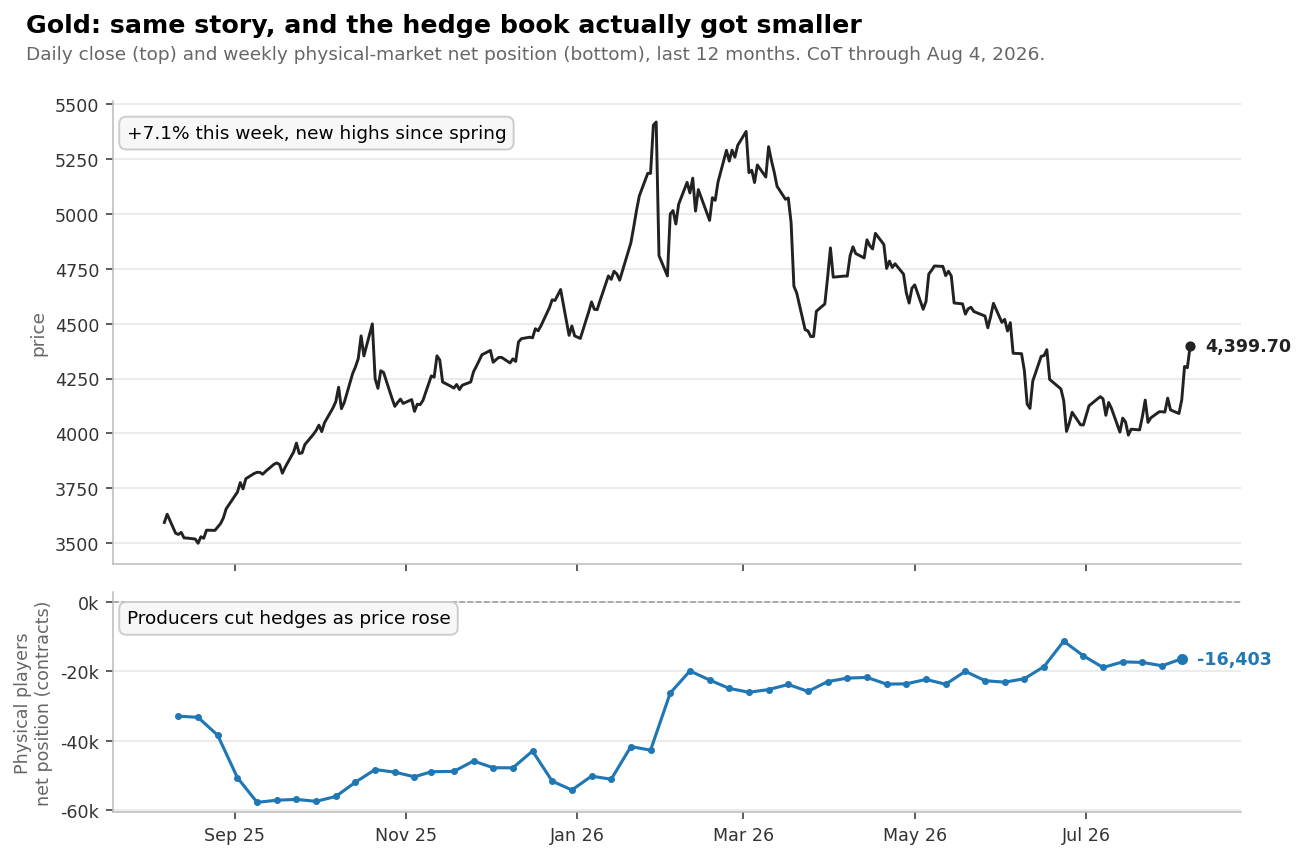
Up 7.1% to $4,399, and its producers cut about 1,050 short contracts while price ran, their positioning is genuinely more unusual now than before the rally.
Platinum rose 6.1%, and there the hedge book moved the other way, slightly less stretched than a week ago.
So, precisely: two of the three tells stayed supportive through the rally: silver held at its extreme, gold strengthened, platinum eased. That’s the most useful thing in this week’s report, and it points forward instead of backward.
The Rest, Fast
Equities. The S&P closed at a three-year high, with the MidCap 400 and Russell 2000 right behind.
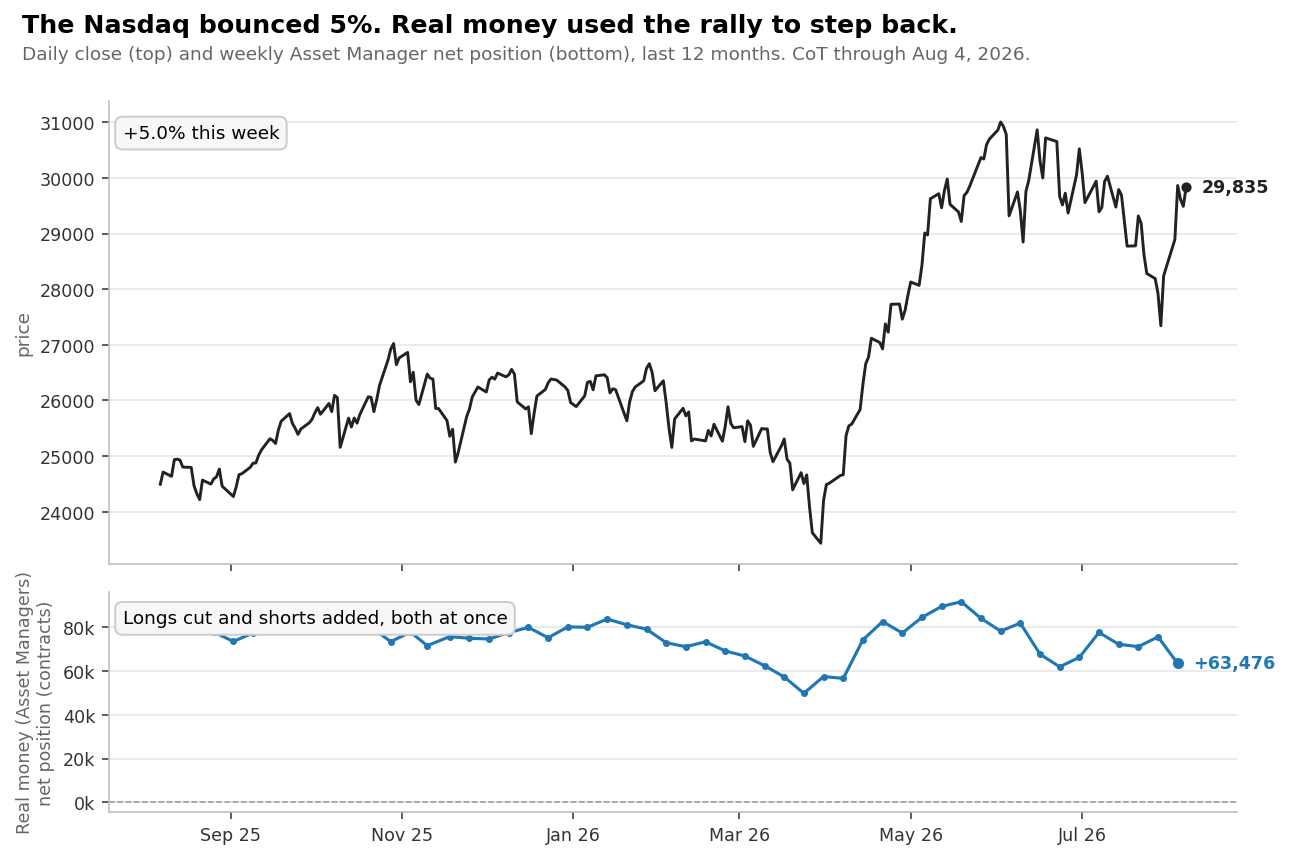
The Nasdaq bounced 5% but is still under its July peak and real money used the bounce to step back, cutting about 6,800 longs while adding about 5,400 shorts.
Their sharpest one-week cut since mid-June.
Sugar. A 12.2% week, the biggest move on the board, and I don’t have a positioning story for it yet. Sometimes the data is quiet while price is loud or vice-versa :)
Trading Idea…
Now, let’s talk about the thing I’ve actually been working on…
The Crude Strategy: 203 Trades, PF 2.26, 62% winrate
Everything above is a read.
A read doesn’t have an entry, an exit, or a drawdown number as you know.
So for the past few days I’ve been trying to turn one of these positioning ideas into a system with rules, on crude oil, long only, on daily bars (1440min).
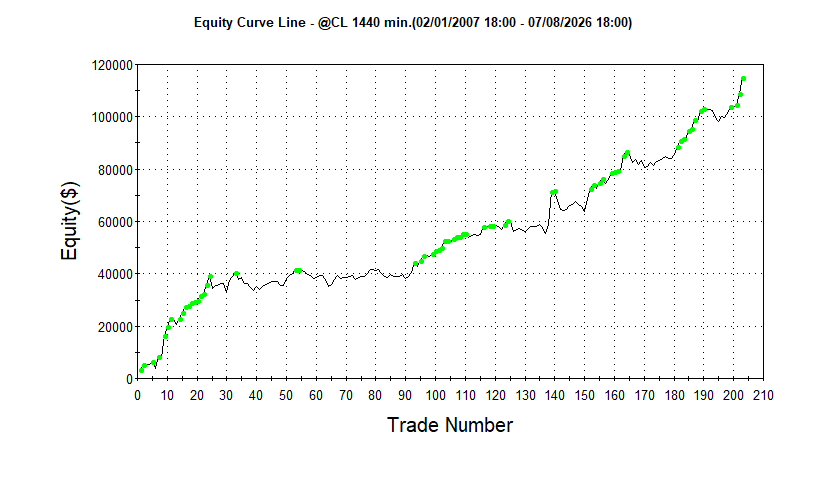
Here’s what it produced from 2007 to today:
The headline numbers:
203 trades, all long, over 16 tradable years
$115,065 net profit, profit factor 2.26
62.56% winners (127 of 203), average win 1.35× the average loss
Worst drawdown, measured peak to valley including open positions: $19,570
Average hold: under three days
It averages about thirteen trades a year, holds each for about three days, and spends the rest of its life in cash (or in other strategies).
Year by year:
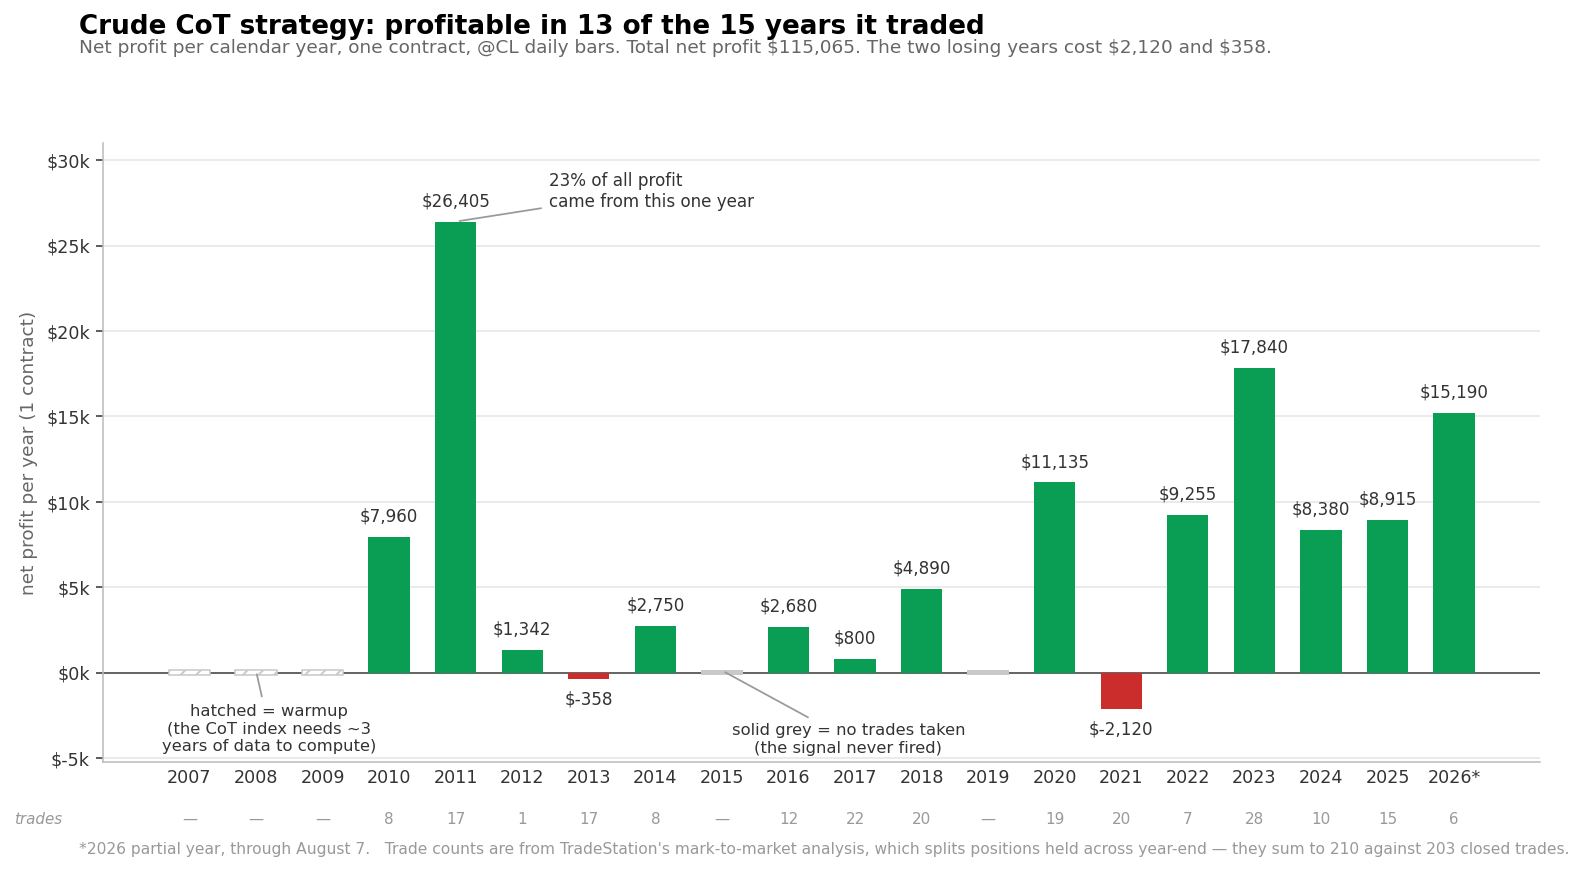
Thirteen of the fifteen years it traded finished positive.
The two that didn’t cost $2,120 in 2021 and $358 in 2013, trading one contract.
Now the parts I’m not going to bury, because they’re the parts that decide whether this is real rather than lucky:
There are two drawdown numbers and the big one is the honest one.
Measured trade close to trade close it’s $8,070.
Measured peak to valley with positions open (which is what you actually sit through, it’s $19,570.
That’s the number in the bullet list above, and it’s the one that matters.
The profits are concentrated. 2011 alone produced $26,405, or 23% of the entire sixteen-year result.
The best three years account for just over half. Take 2011 out and this goes from a great backtest to a decent one (but since 2020 profits are consistents at the same range).
Thirteen trades a year is a small sample. 203 trades across sixteen tradable years is fewer than a day trader takes in a month. So you have to keep that in mind.
Two of those grey years aren’t what they look like. In 2015 and 2019 the signal genuinely never fired. But 2007 through 2009 are warmup: the positioning index behind this needs about three years of history before it produces a value at all. That’s why the first trade is in 2010, and why the real track record is sixteen years, not nineteen.
So what’s the trading logic?
Two conditions.
A positioning regime filter that has to be switched on, plus a short-term price pattern that has to line up while it is.
Both are simple enough. The way I like it.
And the positioning number isn’t crude’s. It doesn’t come from the oil market at all…
The exact conditions, the parameters, the full code, and the one open question that could still sink the whole thing are below.
Let’s dive in…
The Complete Trading Rules