


I Backtested The Legendary Turtle Trading Strategy Across 40 Futures Markets
From Crude Oil to Bitcoin, here’s how a 1983 system fared in today’s markets (code included)

Imagine this…
You’re a complete beginner trader…
Someone gives you a crash course on trading — just a couple of weeks — and a short while later, you’re managing millions…
Profitable
Sounds too good to be true?
Well… that’s exactly what happened with the Turtle Traders.
(A story you’ve probably read a dozen times if you’ve been around markets for a while.)

Back in the 80s, a group of novices armed with nothing but a breakout system and risk rules became some of the most talked-about traders of their time.
Four decades later, I wanted to know:
If those exact same rules went toe-to-toe with today’s markets: high-frequency algos, crypto, and all, could they still swim?
So I took the pure long-side Turtle code — 20-day breakout, 10-day exit, ATR stops — and let it loose on:
40+ futures markets
Including: Bitcoin & Ethereum
Same rules. Same risk. No optimizations.
Just the Turtles, thrown into the deep end.
The Experiment Setup
I coded up the original Turtle Trading strategy and ran it through a meat grinder.
The test parameters:
43 different futures markets
18 years of data (2007-2025)
Every single trade logged and analyzed
The markets I tested…
Traditional stuff: S&P 500, Gold, Crude Oil, Treasury Bonds
Agricultural: Soybeans, Corn, Wheat, Coffee, Sugar, Cotton
Currencies: Euro, Yen, British Pound, Swiss Franc
Energy: Natural Gas, Heating Oil, Gasoline
And yes... Bitcoin and Ethereum (because why not test a 1980s strategy on crypto?)
No curve-fitting.
No parameter tweaking.
No “but in real life I’d just…” adjustments.
Think of it as throwing the Turtles into the 2025 markets with the exact same gear they had in 1983, and watching what happens.

Could the original Turtle DNA still hunt for trends in a completely different ecosystem?
The Turtle Rules
The strategy itself is beautifully simple:
Buy when price breaks above the highest high of the last 20 days.
Sell when price breaks below the lowest low of the last 20 days.
Position size based on volatility (they used something called Average True Range).
Exit when price reverses direction for 10 days.
That's it. No indicators. No complex algorithms. No AI. Just pure price action and math.
The beauty was in the execution, not the complexity.
But here's what I really wanted to know…
Which markets would this work on today?
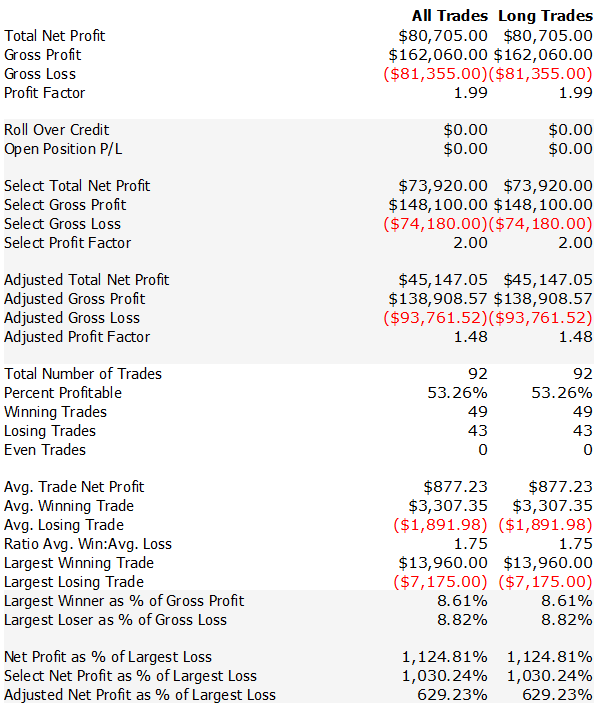
The Results
Ready for this?
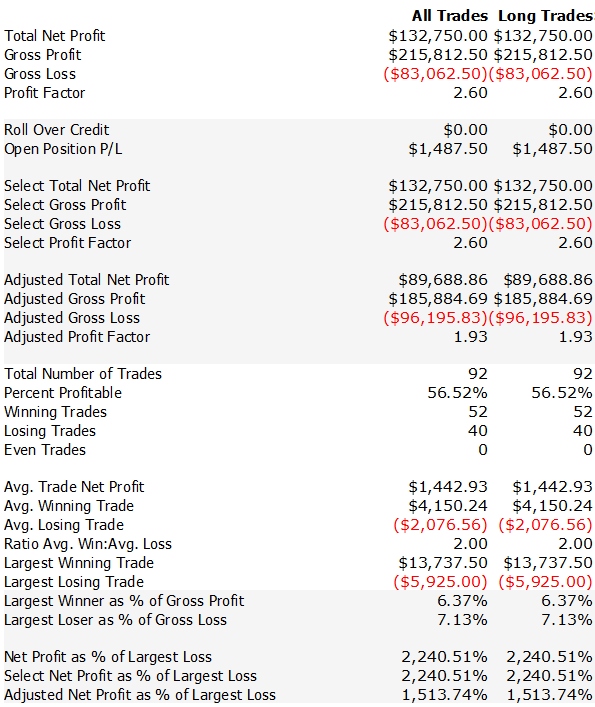
Total profit across all 43 markets: $1,147,318
But here's the thing about that number...
It's completely misleading.

See, when you're looking at 43 different markets, the winners and losers tell a story that the total doesn't capture.
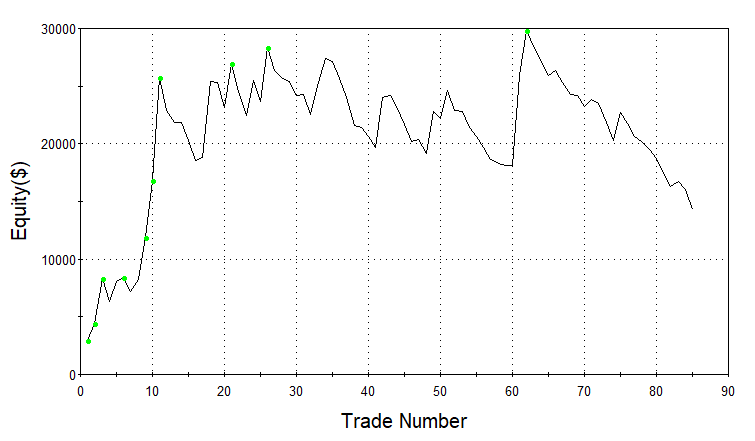
For example, we had nice equity curves like this:
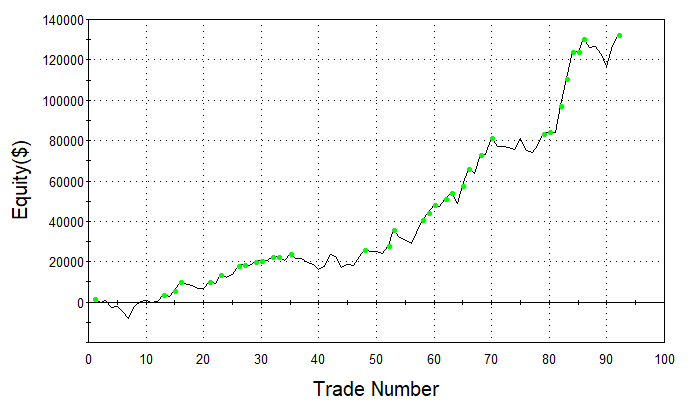
Or this…
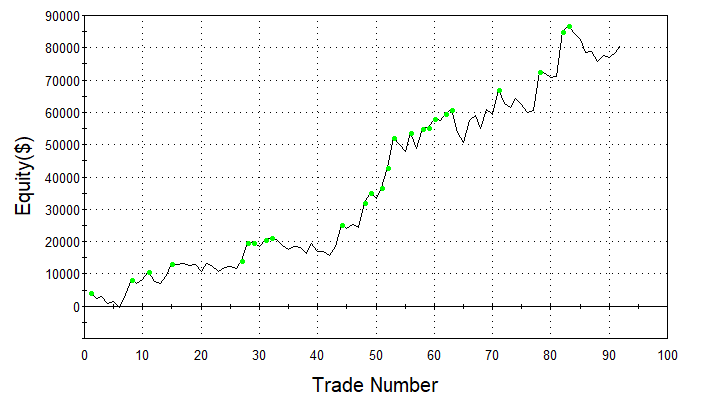
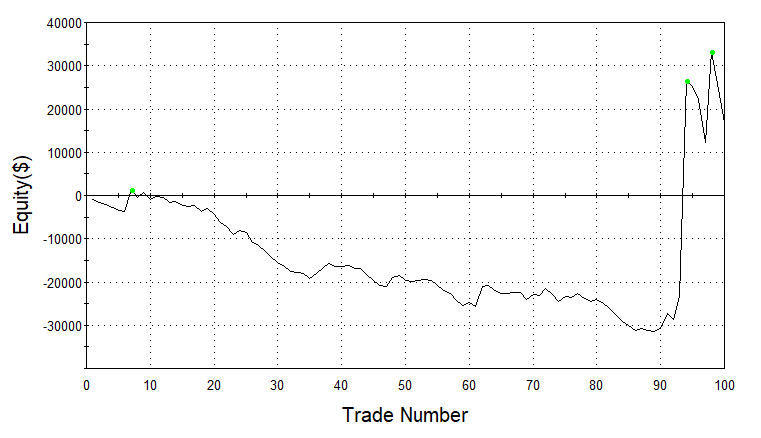
But also this:
And this:
But here's what I want to emphasize before I reveal the full breakdown of which markets performed the best (and also share the actual code with you)…
I didn't do ANY optimization.
Zero curve-fitting.
No parameter tweaking.
No "well, if I just adjusted this one thing..." modifications.
This is the raw, unfiltered performance of the original 1983 Turtle rules thrown into modern markets.
The key point is that the best strategies aren't the most complex ones.
They're the ones that capture fundamental market behavior that doesn't change.
Human nature still drives trends.
Fear and greed still create momentum.
And breakouts still work when markets actually want to trend.

But which markets rewarded this simplicity... and which ones punished it brutally?
Below you get the complete market-by-market performance breakdown…
The exact symbols that generated those nice equity curves above…
And the full code…
Let’s get into it…