


I Backtested Larry Williams’ Trading Strategy Across 15 Markets
Here’s What Actually Worked...

Three years ago I broke a tooth.
No, it wasn't in a bar fight.
I broke a tooth while sleeping—technically, I just cracked it.
My mom told me to go see her dentist.
Nice guy. Funny.
We started chatting (well, mostly him talking since my mouth was open and all I could say was "uh-huh" and "mm-hmm").
At some point, he asked what I did for a living.
I told him, "I'm a trader."
Left out the "systematic" part to keep it simple.
That’s when the conversation got interesting.
He looked at me and said:
"Me too!"
Then he launched into an explanation of his forex trading strategy he learned from a YouTube video that promised a 90% win rate.

According to him, it was working…
I gave my 2 cents but he had it all figured out…
Start with $1,000. Trade leveraged. Follow the magic system. And boom — become a millionaire in 12 months.
Because (his words) "the broker allows it (the leverage)."
The end of that story wasn’t pretty.
I’ll save it for another time.
But it reminded me of another high win-rate story.
One you’ve probably heard of:
Larry Williams.
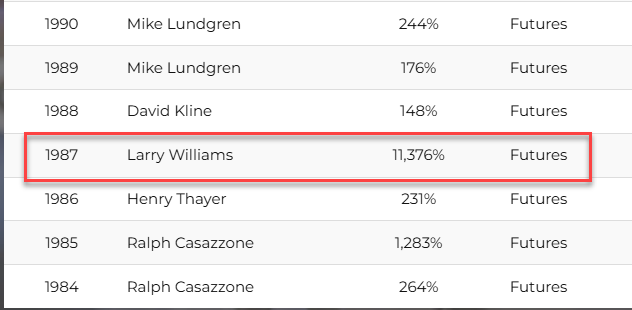
In case you haven’t — he’s the guy who turned $10,000 into over $1.1 million in 12 months at the Robbins World Cup Trading Championship.
So maybe my dentist wasn't that crazy after all?
Well...
Anyway, I wanted to bring you one of the strategies that made Larry Williams famous back in 1987 that he shares in his book.
Ready?
Let’s go.
The Smash Day Pattern
By the way, his book Long-Term Secrets to Short-Term Trading has a bunch of ideas worth exploring. I highly recommend it.
We’ll look at one of them today — and how one simple setup can generate dozens of variations to test.
The Setup
Larry describes these patterns as days when the market breaks a key price level, pulling the public into a bad position, only to reverse hard the next day.
He calls it…
Smash Days
and there are two types:
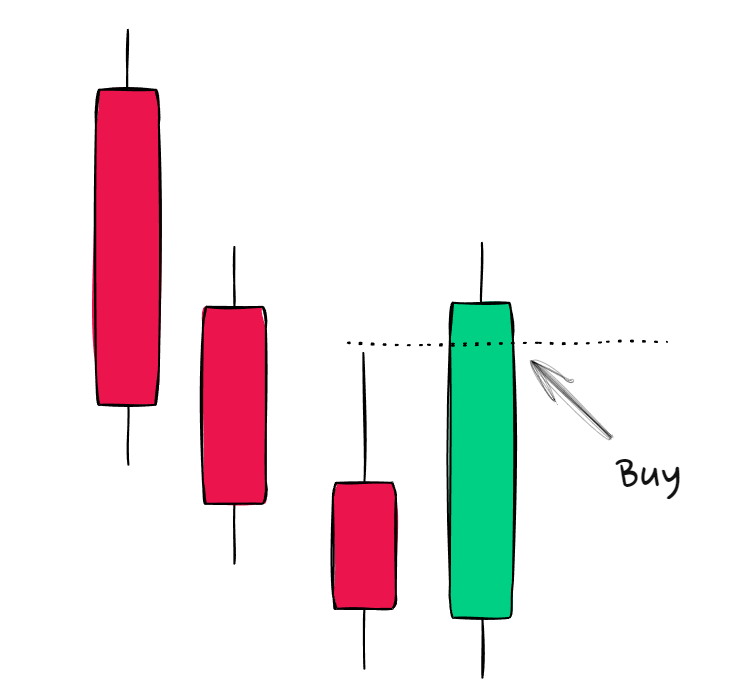
Smash Day Buy
A day that closes below the low of the previous day
Often also breaks the lowest low of the past 3 to 8 days
Triggers a buy if the next day trades above the Smash Day high
Smash Day Sell
Opposite pattern
A day that closes above the high of the previous day
Possibly also breaks the highest high of the last 3-8 days
Triggers a sell if the next day trades below the Smash Day low


Why It Works
Williams firmly believes that when "what should happen in the market doesn't happen," this is powerful evidence to make a trade aligned with the new information.
I'll highlight this phrase that is—in my humble (but correct) opinion—more important than the setup itself:
When what should happen in the market doesn't happen, this is powerful evidence to make a trade aligned with the new information.
The 'breakout' they anticipated fails. They've 'taken the bait,' and price responds with a reversal, offering an excellent entry point for the trader who recognizes this pattern."
This is important because it makes you think about trading hypotheses.
You should always think about probable situations as if you're playing game theory (for the econ nerds out there).
Because this gives you a hypothesis to test and different angles to work with the central idea.
In summary, from one hypothesis, you'll have 10, 20, 30, or more ideas to test.
And that's what I'm going to show you...

Back to the setup…
It consists of a day that closes below the previous day's low.
These days may even break below the lows of the previous 3 to 8 days.
This means the previous day's close must have the lowest low of the last 3 (up to 8 days).
Here’s what I mean (visually)…
In his book, Larry also mentions some markets where this strategy works well, such as:
Silver
Wheat
Gold
Stocks
Let's test the idea on Silver then.
But first…
What about the exit?
In the book, Larry mentions 3 main rules for exiting a trade:
Rule #1:
Use a dollar stop on all trades for protection in case everything goes wrong.
Rule #2:
Use the "bailout" technique.
Essentially, you should exit on the first positive opening even if the profit is just one tick.
Rule #3:
Exit and reverse position if an opposite signal appears. With this rule, you're always in the market, either long or short.
In this article, we'll focus on rule #3.
Ready?
Before that let’s take a look at the methodology…
The Methodology
I tested the strategy on 15 assets: Silver, Gold, SP500, Dow Jones, Nikkei, Nasdaq, Russell, Bonds, Euro, Yen, Pound, Soy Beans, Coffee, Rough Rice, Wheat and probably other 10…

I defined the backtest period as the last 10 years: 2014 to 2024.
I used $2.5 and $12.5 as a fixed per contract commission and slippage.
Here are the results
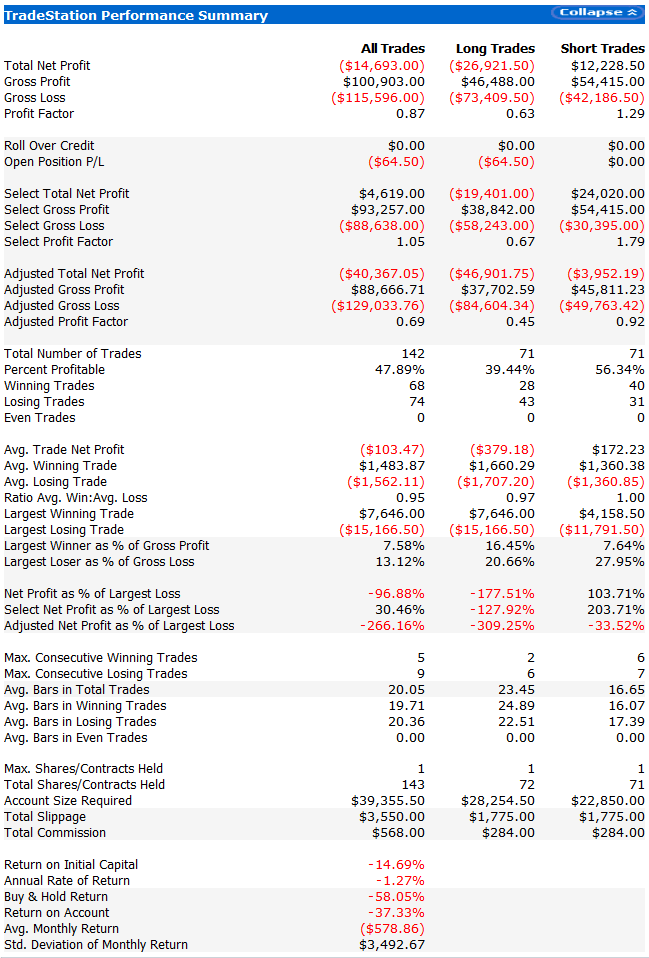
The first asset was Silver.
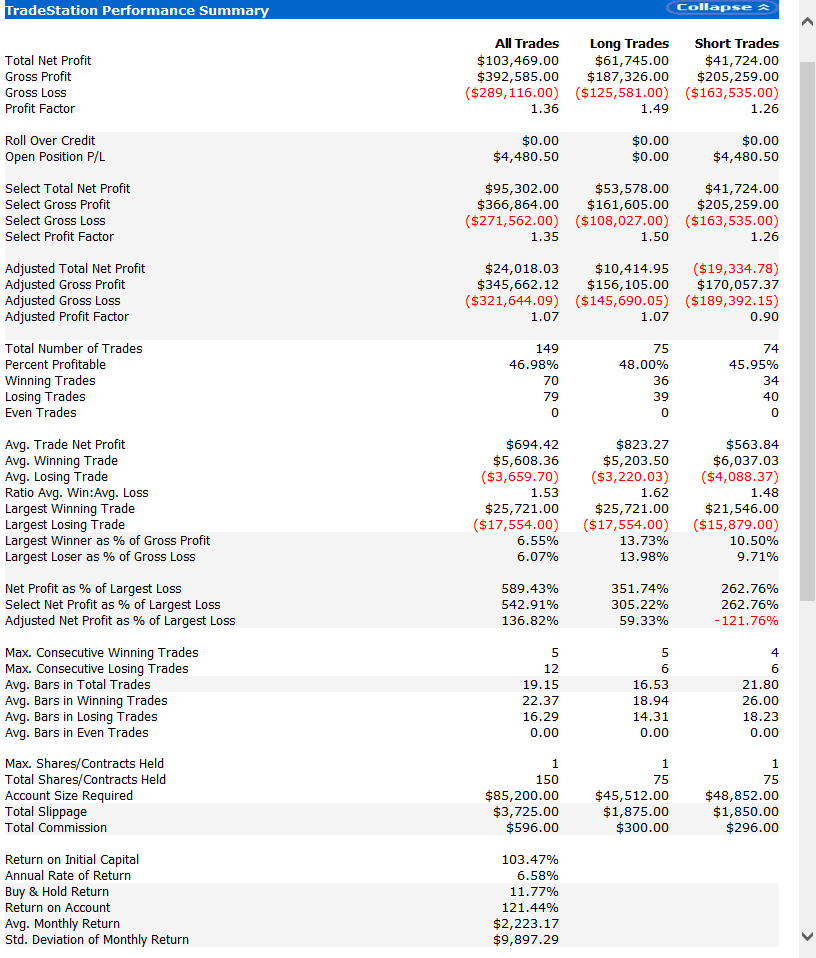
The numbers aren't that impressive, but when we look at the equity curve...
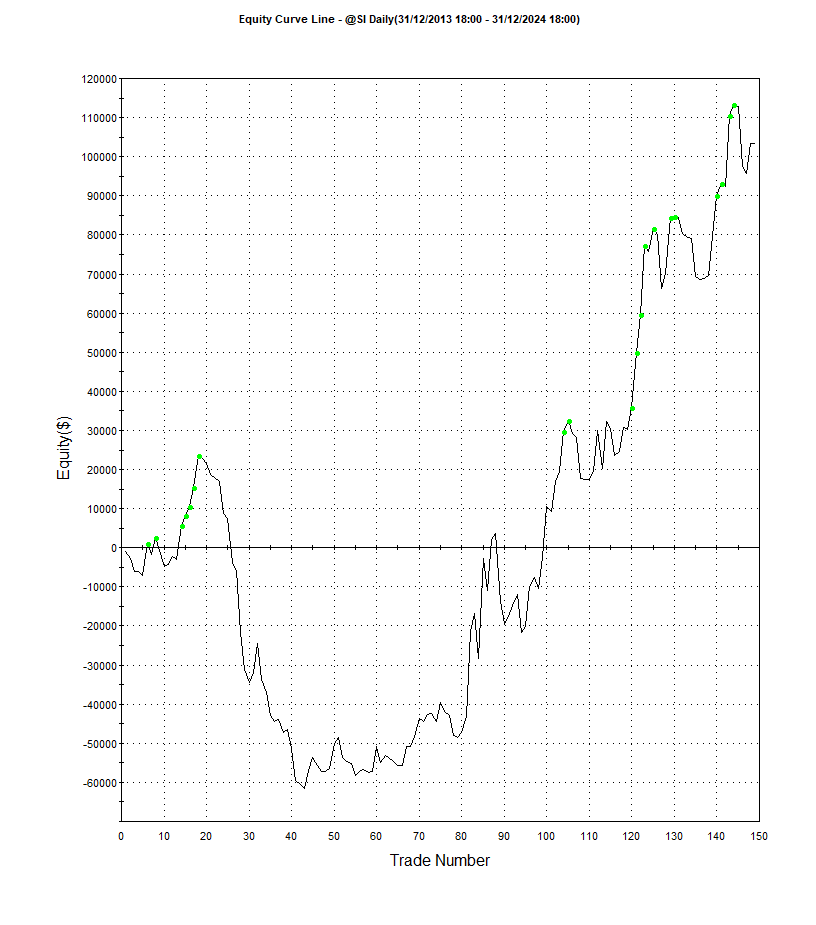
Ouch...
Not what I expected...

But remember how Larry suggested using the close lower than the last 3 to 8 periods as a trend identifier?
In this case, I used 3 periods and then ran the test to see how the other periods (4, 5, 6, 7, and 8) would perform...
And...
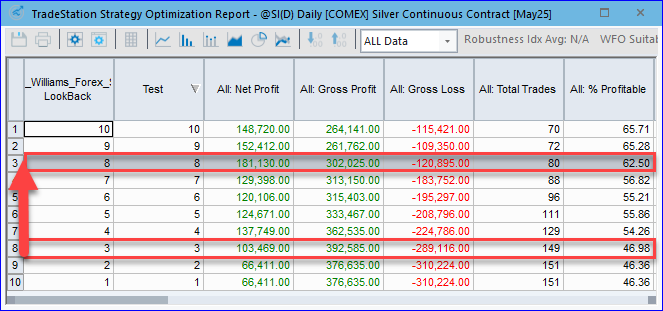
You can see that the shortest lookback periods show the worst results.
And that makes sense.
If we're trading against the trend, the more signals there are of a trend, the more confident traders become in entering in the direction of the trend.
And we're going to do the opposite.

It's also interesting to note that 8 is the best number of all; after that, the profit starts to decline again.
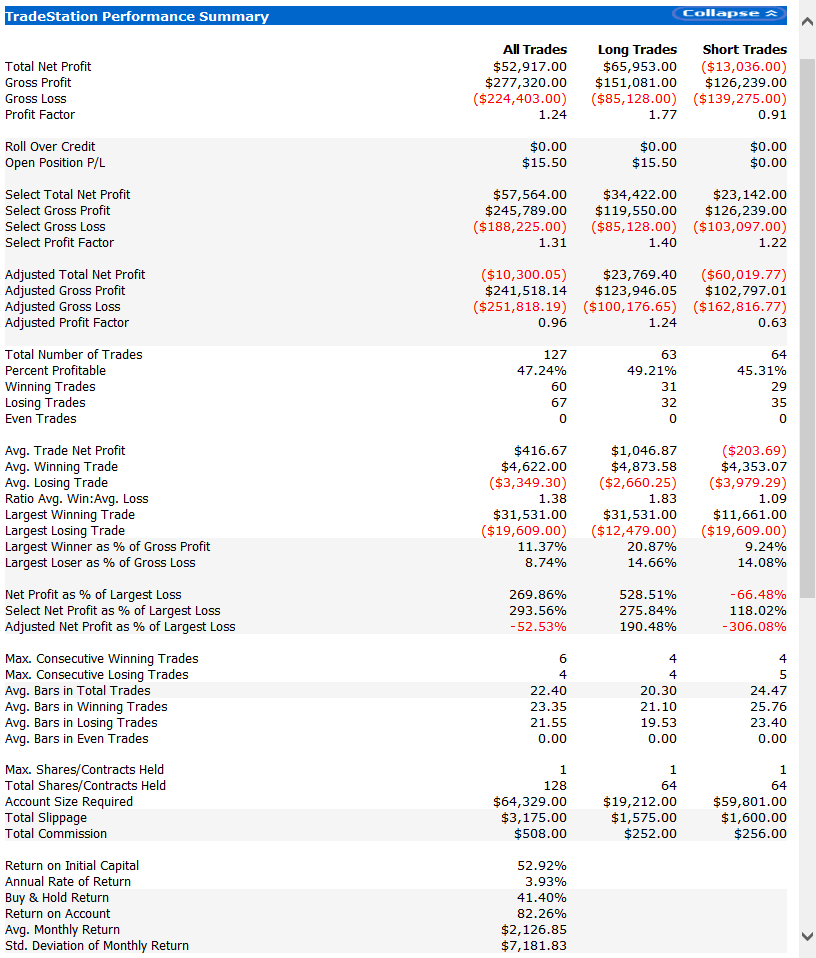
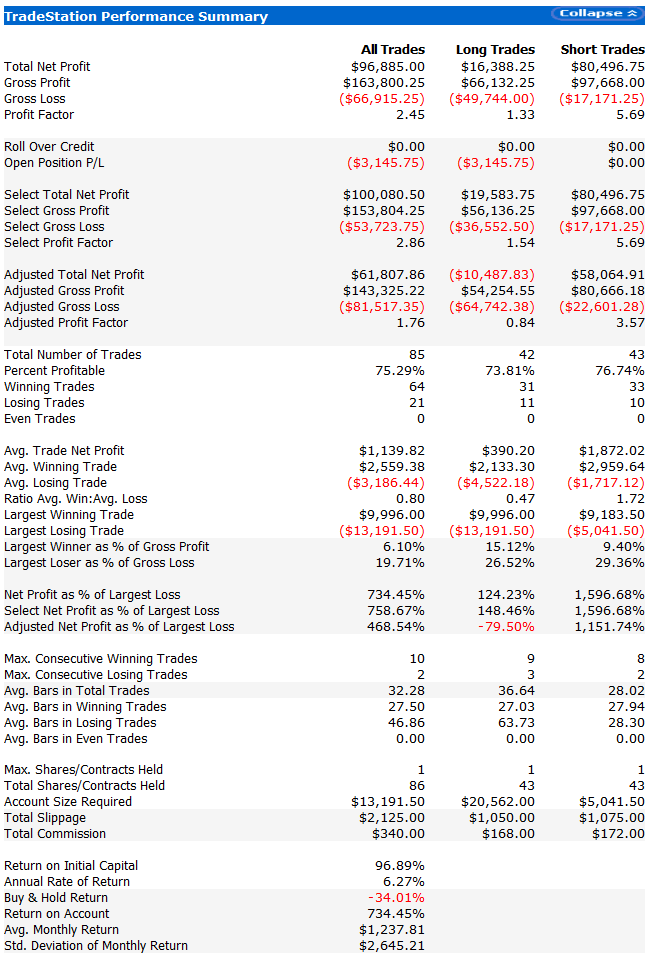
Let's take a look at the difference in results...

It's significantly better...
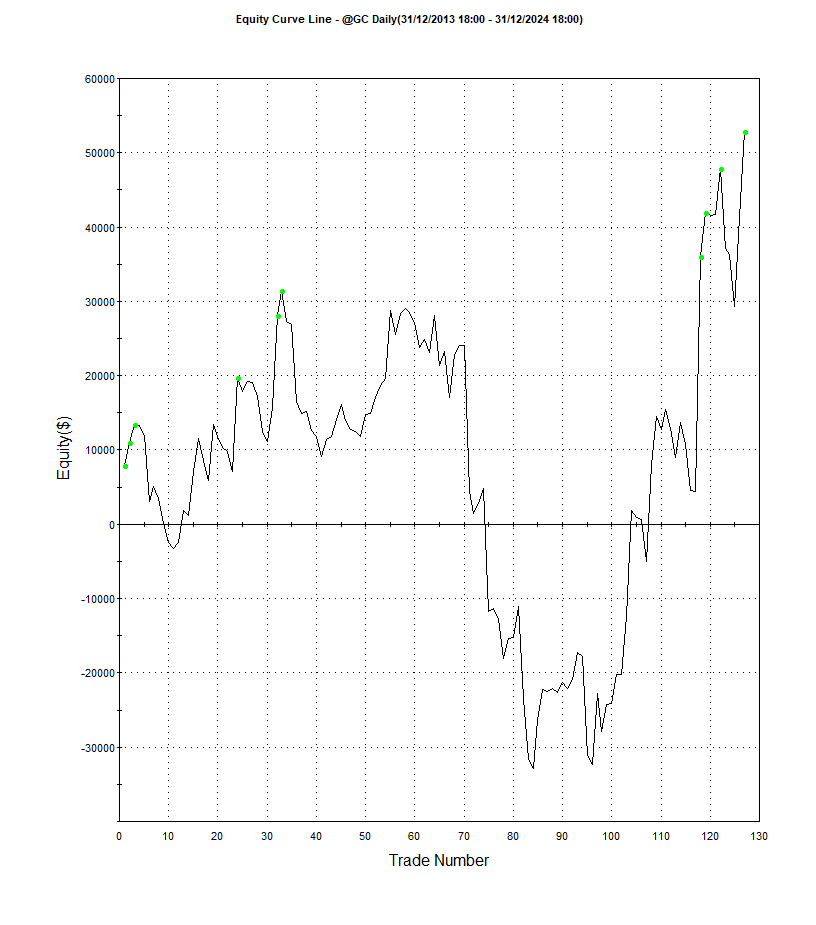
And the equity curve...

Something worth working on further, for sure.
But I warn you again: this was the best lookback period from the test for Silver. I wouldn't call it overfitting but keep that in mind.
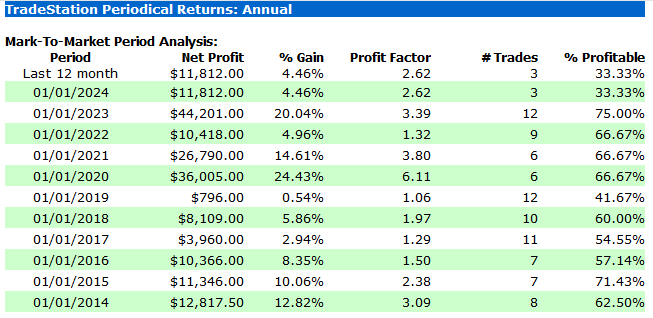
One thing that caught my attention was that we didn't have a single negative year, good sign…

OK, let's move on to the next one...
Since we're talking about metals, let's see the result for Gold...
It's not profitable when trading short.
And for the record, I used a 3-day lookback in this case.
And again, the longer the lookback, the better the result...

The third asset Larry mentioned in the book was Wheat.
I tested it too, and the result was even worse...

I ran the backtest for 12 more assets and found this...
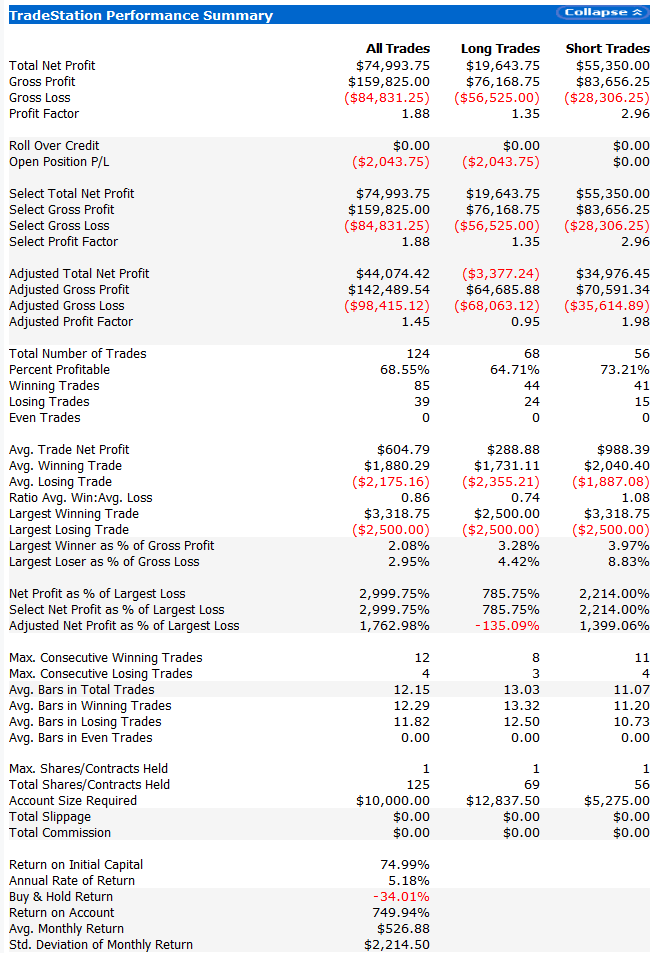
S&P500

Look at the long trades…

80% win rate with a 6.94 profit factor and 1.73 win/loss ratio per trade?
Hmmm, that's something to work on.

For the record, I set the default lookback to 8 periods, not because it was the best for silver, but because I thought it made more sense in terms of defining a trend.
Also, we had - let’s say - a small sample size. Not that small but I’d like to see more…
Other indices like Nikkei, Dow Jones, and Russell showed solid performance for long entries and poor performance for shorts.
Currencies like AUD, CAD, JPY showed the opposite performance…
Good returns for shorts and poor performance for longs. The same with Natural Gas and Platinum.
The best currency by far was the Euro.

Among commodities, Rough Rice, Coffee, and Soybean stood out.
Then I thought, what if we used another exit like a stop?
The result worsened in almost all tested assets.

But the Euro continued to perform well, as you can see below...

In summary...
Metals:
Silver: Positive results with 8-period lookback, without any negative years
Gold: Profitable only in long positions, better performance with longer lookbacks
Platinum: Mixed results, slight edge on the short side
Indices:
S&P 500: Impressive 80% win rate in long positions, with a profit factor of 6.94
Nikkei, Dow Jones, Russell: Strong performance for longs, weak for shorts
Currencies:
Euro: The standout performer among currencies, with good results in both long and short positions (but even better on the short side)
Australian Dollar, Canadian Dollar, Japanese Yen: Best returns in short positions
Agricultural Commodities:
Wheat: Disappointing results, contradicting Larry's original recommendation
Rough Rice, Coffee and Soybeans: Ok to good performance among commodities
Key Patterns and Observations
Lookback Period: In almost all cases, the longer lookback (8 periods) produced superior results (which significantly reduces the chances of this being overfitting). This suggests that the stronger the evidence of a trend, the higher the probability of a significant counter-trend move.
Asymmetry Between Longs and Shorts: The strategy showed clear asymmetry between long and short positions:
Stock indices performed best in long positions
Currencies performed best in short positions
Exit Rule Robustness: When we tested variations in exit rules (such as implementing stops), performance worsened for most assets - with the notable exception of the Euro, which maintained good results regardless of exit method.
Next Steps
If you want to explore this strategy further, consider:
Testing on different timeframes like the 60 minutes
Adding trend filters (but keep in mind you’ll have fewer trades)
Exploring hybrid exit rules to optimize profit factor (for example a trailling stop or a time based stop)
Conducting more robust tests like walkforward analysis to confirm the validity of the results (maybe using the lookback period)
Remember: there's no silver bullet in trading. This strategy, like any other, should be tested, adapted, and incorporated into a complete trading system with proper risk management.
But you already know that (I suppose)


Also, paid subscribers will receive via email on Monday morning:
The full code in EasyLanguage and Python
A detailed analysis of an extra 5 forex pairs I tested
And a second version of the code that is, let's just say... quite interesting...


If you're not a paid subscriber yet, now is the perfect time to become one…
DISCLAIMER:
This script is provided for educational and informational purposes only. It is not financial advice, nor a recommendation to buy or sell any securities or financial instruments. Trading involves substantial risk and is not suitable for every investor. You are solely responsible for your own investment decisions and should seek advice from a licensed financial advisor before acting on any information provided in this code and article. The author(s) and publisher disclaim all liability for any loss or damage arising directly or indirectly from the use of this code, including but not limited to trading losses, data inaccuracies, or system errors. Use this code at your own risk.
Nice work RQ
Great article! I like your style.
The problem with Larry Williams' patterns—I think I've studied them all—is that they have little statistical significance, and also that this difference masks the true power a pattern can have, although it's an interesting technique to use if you need it for your goals. It's always interesting to study the master Larry.
Congratulations on the article!
Quant Power!
Enjoy. ;)