
I Backtested a Famous Candlestick Pattern on 43 Futures Markets...
Here's the results with best and worst performers (code included)

“Shoot for the moon. Even if you miss, you'll land among the stars.”
―Norman Vincent Peale
But what if you've been aiming at the wrong target this whole time?
That's exactly what I discovered when I tested a famous candlestick pattern accross 43 different futures markets.
Here's the story that will make you question everything you know about a particular candlestick pattern (or all of them…)
What the hell is a shooting star anyway?

Let me steal the definition from Investopedia:
“A shooting star is a candlestick that signals a potential bearish reversal. It is characterized by a small real body near the lower end of the candlestick, an upper shadow that is at least twice the size of the body, and little or no lower shadow.”
Translation: It looks like an inverted lollipop with a really long stick.
If you’re a visual person like me, then…

The story goes like this:
Buyers push price up during the day (that's the long stick), but sellers smack them down by the close (that's the small body at the bottom).
Every trading book says:
"When you see this, sell! Price is going down!"
Is it?
Why most traders are basically gambling
Here's the dirty secret nobody talks about:
Most traders never actually test their strategies.
They read a book.
Watch a YouTube video.
Maybe take a $2,000 course from some guy with a rented Lamborghini…

Then they start trading real money based on... what exactly? Hope? Vibes?
When traders talk about candlestick patterns, they just assume they work. Period.

The uncomfortable truth?
Most popular patterns work about as well as flipping a coin.
But everyone keeps using them because:
They're in every trading book
"Smart" traders mention them
They feel scientific-ish
Confirmation bias is a hell of a drug
Meanwhile, your account balance is doing the opposite of shooting to the stars.
So I decided to do something “radical”…
Actually test this pattern.

The Test
Here’s what I did.
43 different futures markets (everything from Bitcoin to lean hogs)
18+ years of data (January 2007 to July 2025)
Same exact rules for every single test
10-period lookback (industry standard for pattern recognition)
5-bar maximum exit (get in, get out, move on)
No optimization (what you see is what you get)
The traditional shooting star logic was simple:
See shooting star → Sell short → PrayI ran this strategy across everything:
Crude Oil, soybeans, gold, natural gas, you name it.
The results?
From 43 markets, we had 17 positive returns and 26 negative returns
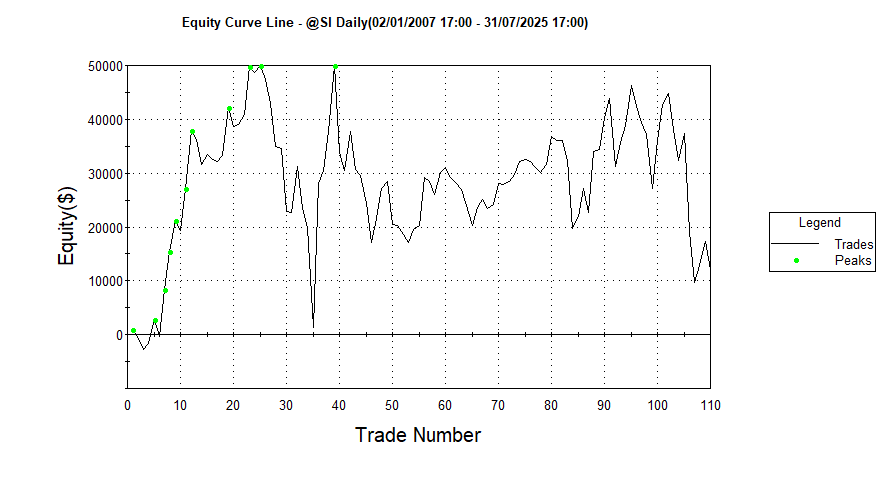
This doesn't mean that the positive results were something that I or you would actually trade, just that the final result was positive like this one from Silver...
In short, here’s the 5 best performers…
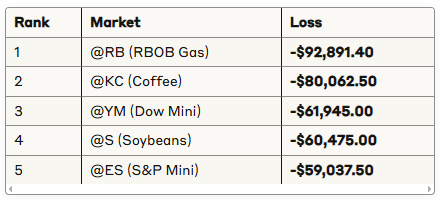
And the 5 worst…
I’ll show you the full results in a moment but first the complete picture…
The math:
17 winners vs 26 losers
Total P&L: Actually negative (when you add it all up)
[GIF: Calculator showing error message]
That's when I realized I might be onto something completely backwards…
The "what if" moment…
The traditional shooting star strategy was... mediocre at best.
More losers than winners.
Overall negative returns.
But something bugged me.
If selling shooting stars lost money in most markets, what if I... bought them instead?
Every trading book says: "Shooting star = sell signal!"
But what if every trading book was backwards?
So I did the dumbest/smartest thing possible:
I flipped the code.
Instead of:
if shootingstar then sellshort next bar at market;I changed it to:
if shootingstar then buy next bar at market;One word. One tiny change.
Here’s the results…
The (inverted) results

I ran the same 43 markets. Same rules. Same everything.
Except now I was BUYING shooting stars instead of selling them.
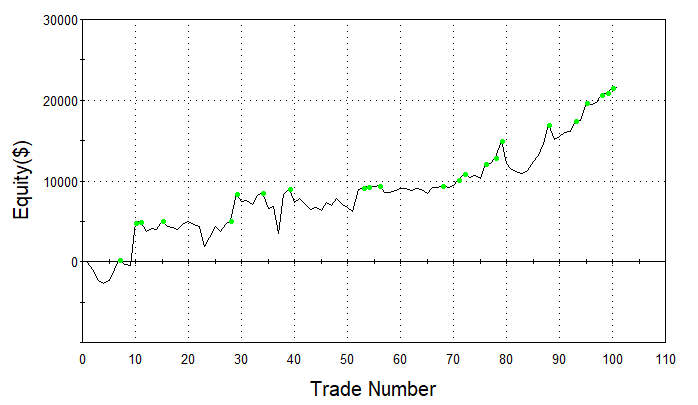
Now I got some equity curves like this...
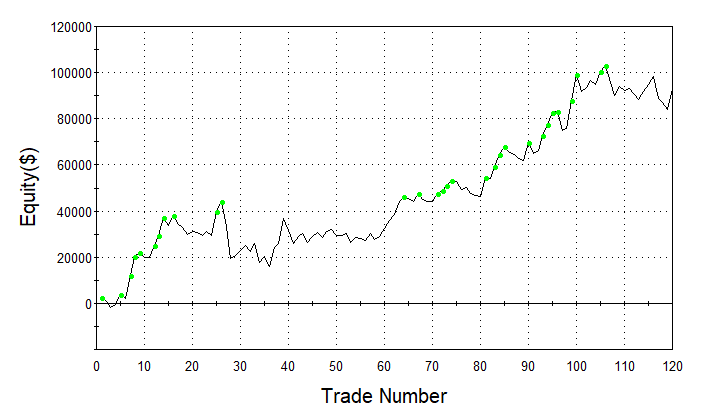
And this…
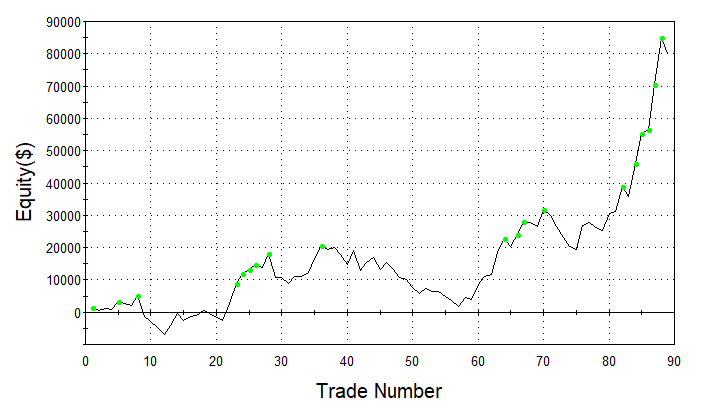
or this…
A perfect strategy?
Of course not.
But the fact that it produced WAY better results than the original logic is... somewhat surprising.

And if you're wondering which were the best-performing assets, I'll share that with you in a moment.
But first, I want to highlight the importance of not just backtesting, but multiplying the possibilities to test from a single idea.
For example, I didn't run anything on different timeframes.
I didn't test the logic on stocks.
I didn't apply any kind of filter (like a simple moving average, for instance).
All of this to show you that from a single idea you can generate 10, 20, 100 different ideas.
What you need is a solid process to follow.
Ok, enough systematic trading lessons.
Let's get to the results as well as the code I used…