How volatility compression in bonds creates explosive trading opportunities
A simple breakout strategy that delivers 15 profitable years out of 18

Mornings are usually kid time for me.
Whether I'm taking them to music classes or just letting them drag me into whatever elaborate game they've invented, work takes a backseat.
But sometimes they get absorbed in their own little world…
building something, drawing, or just quietly playing (it’s rate I know but happens…)
That's when I sneak over to my computer.
and last week, I had two subscribers asking for a bonds strategy.
One of the perks of being a paid subscriber, by the way, you get to request specific markets or throw ideas at me to test.
So there I was, scrolling through my strategy ideas, looking for something that might work in the futures bond space.
I was completely absorbed in the research when suddenly I realized...

It was way too quiet.
You know that feeling if you're a parent.
When kids go silent, your radar goes up.
"What are they up to?"
I went to check on them and they were fine, just focused on building this massive Lego creation.
But that moment of suspicion gave me the perfect analogy for today's strategy.
You've heard the phrase "the silence before the storm", right?
Well, volatility compression is the market's version of that eerie quiet.
And just like with kids, when things get too quiet in the markets, you better pay attention.
Because something's about to happen.
The Pattern
To be honest, I'm not sure where I got this idea since it was without source reference in my files.
But the idea is simple and very possibly applicable to many other markets.
The idea is volatility compression.
When volatility compresses beyond normal ranges, the market builds potential energy that releases in violent, tradeable moves.

Basically, we’re measuring volatility on two horizons (short vs long) and calculating the ratio.
Then we define a trigger to enter a trade based the that ratio.
What we'll cover
We'll start by examining how extreme volatility compression often precedes explosive price moves in bond futures.
After that, we’ll expalin the edge itself: the short- vs long-volatility ratio, the breakout trigger, and the logic that turns market “silence” into an actionable trade.
Following the setup, we’ll present the backtesting results covering 18 years of 30-Year Treasury data, complete with realistic cost assumptions and robustness checks.
We’ll close with the full code for copy-paste use, plus practical implementation notes so you can refine or adapt the strategy to your own trading style.
The mechanics
The context:
Volatility in bond markets follows cyclical patterns.
Artificial compression creates imbalance that markets correct through directional moves.
The core strategy:
Calculate short-term volatility measure
Calculate long-term volatility baseline
Monitor the ratio between them
When this ratio drops below a certain threshold, the market is "compressed"
Wait for price to break out of recent ranges to confirm direction
Market logic:
When volatility compresses beyond normal parameters, it creates structural imbalance that corrects through directional price movement
Trigger mechanism:
Price breaks beyond recent ranges (for example, 10-period highs/lows) provide directional confirmation without needing complex filters.
The beauty is in the simplicity.
No indicators, no complex math, just pure price action responding to compressed energy.

Testing methodology
Data:
30y Treasury futures (US) daily data from January 2007 through June 2025.
18+ years covering multiple interest rate cycles, from the 2008 crisis to COVID chaos to the recent inflation surge.
Transaction costs:
$32.5 for commissions per round trip (realistic for retail futures trading)
$2.5 for slippage per round trip
Backtest standards:
No survivorship bias, no look-ahead bias, no cherry-picked periods.
Each signal uses only information available at that time.
Performance analysis
Before diving into the complete strategy details, let me show you what this approach delivers.
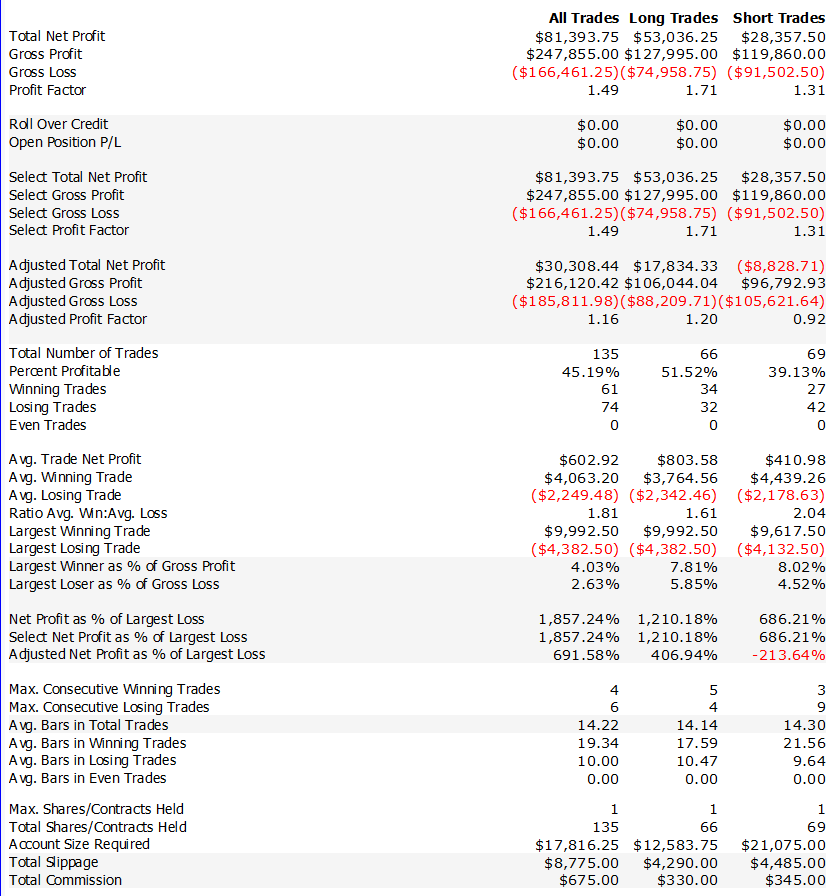
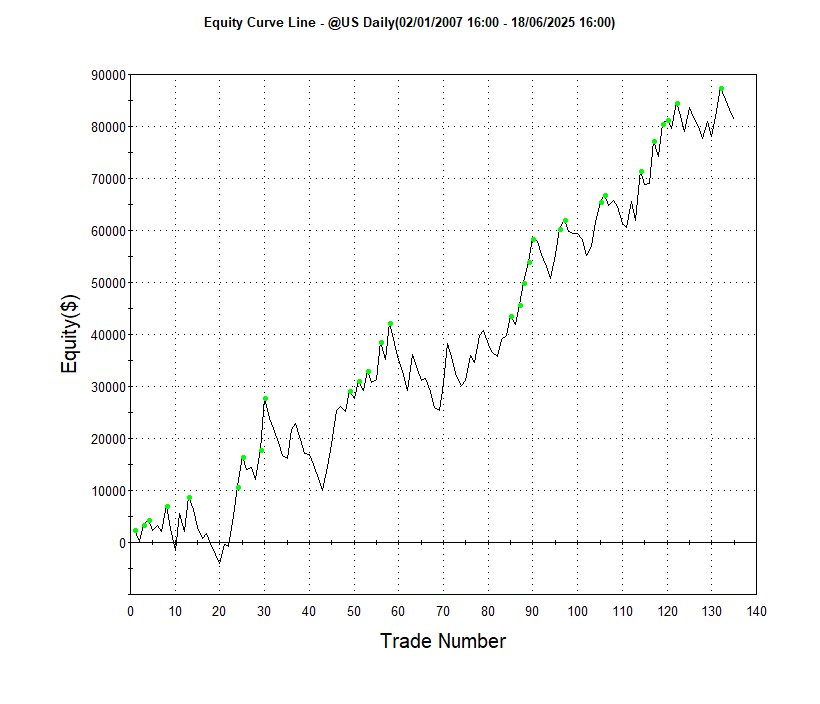
Performance highlights:
Generated consistent returns across multiple market cycles
Max Drawdown (trade close to trade close) was 17.82%
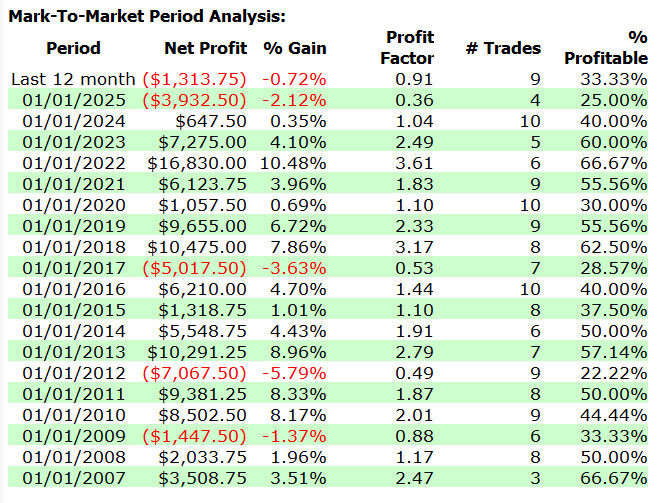
Delivered positive returns in 15 of 18 complete years
Average trade duration: 19 days

good before optimizations…

Aditional considerations
Other markets tested:
I ran preliminary tests on several other futures markets and some showed promising results worth exploring further:
Metals: Platinum
Energies: Crude Oil
Currencies: British Pound
Indexes: Nasdaq and Dow Jones Mini
Softs: Cotton, Lean Hogs, Kansas Wheat, and Oats
Interest Rates: 5-Year Notes, 2-Year Notes, and 10-Year Notes
The volatility compression principle seems to work across different asset classes, though each market has its own quirks.Enhancement opportunities:
Incorporating yield curve slope data could improve timing precision for bond strategies specifically.
Multi-timeframe compression analysis might identify stronger setups across all markets.
The core concept is simple enough to adapt, but implementation details matter for each specific market.
Ok, now let’s get into the code and how you can adapt it and explore this edge further