
Everything Sold At Once (CoT Update 06-12)
Oil, metals, grains, and crypto all fell together over four weeks. The slow institutional money was already positioned somewhere else.

“The market can stay irrational longer than you can stay solvent.” — John Maynard Keynes
Quick note on timing, for newer readers: the CFTC takes its snapshot of trader positions every Tuesday and publishes it on Friday. So the positioning below is from Tuesday, June 9. Prices are from Friday’s close, June 12.
This was a broad commodity sell-off.

Not one market, not one sector: energy, metals, grains, softs, and crypto all fell over the same four weeks.
When that many unrelated markets drop together, the selling is usually about something bigger than any single market.
What we can do is look at who was positioned where when it happened.
The Simple Read
Bitcoin: down 20% in four weeks. Big institutions still hold almost nothing here.
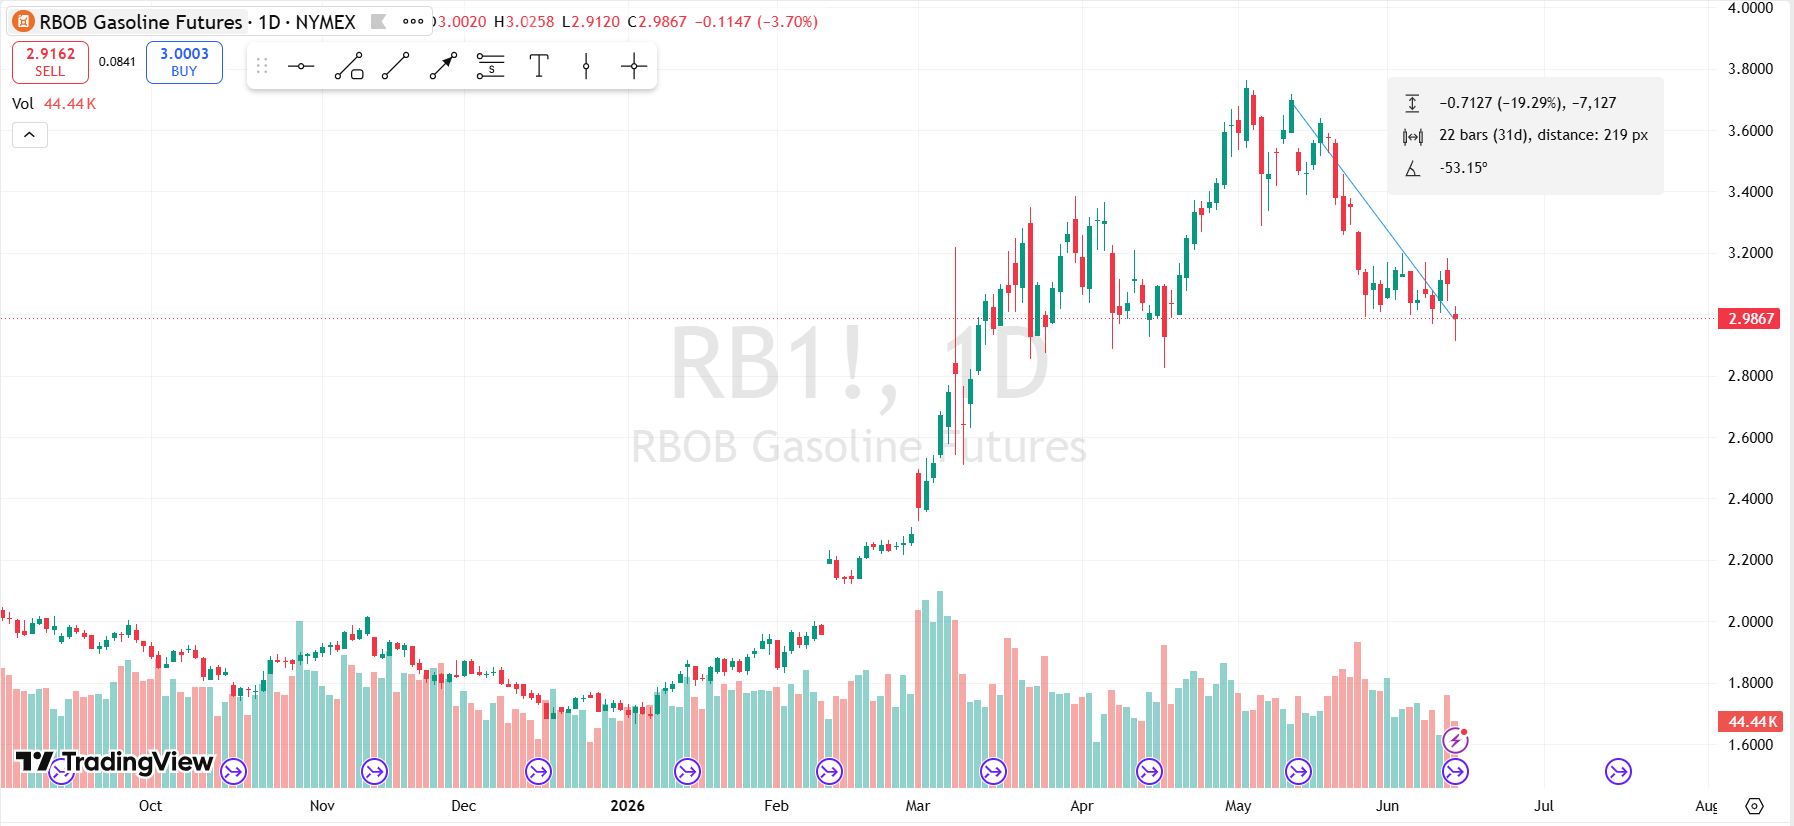
Gasoline and Heating Oil: down 16-18%. The hardest-hit corner of the board.
WTI Crude: down 16%. Commercials are still positioned long.
Platinum: down 14%. Silver: down 12%. Gold: down 7%. Commercials still long all three.
Corn and Wheat: down 8-9%.
Soybeans: down 5% — and the week’s most unusual positioning move happened here.
10-Year T-Note: big institutions added again. Second week in a row.
S&P 500 and Mid Cap: big institutions are long and added to mid-caps this week.
Nasdaq: hedge funds came back in after the rally had already run.
Yen: still sitting at the bottom of its range, and almost nobody wants it.
If you’re an annual subscriber, you have access to:
CoT Edge — the full positioning board behind this report. Every market I cover, scored and ranked by signal strength, updated each week. The percentile and rate-of-change math I do by hand for this newsletter, done for you across dozens of markets in seconds.
Seasonal Lab — decades of futures price data pre-sliced five ways: average return curves with confidence bands, monthly heatmaps, day-of-week breakdowns, and entry/exit windows ranked by Sharpe. Filter for what’s active right now.
Quant Papers — a curated catalog of academic strategies, replicated. I code the rules from the paper, run the backtest on my data, and record the real metrics — Sharpe, return, drawdown, win rate — next to the paper’s claim. Reference code included on dozens papers. You see which papers hold up and which don’t.
Strategy Audit — drop in a trade list of your strategy and and it runs 28 statistical tests focusing on what kill real-money systems: curve-fitting and bad luck in the trade sequence.
Portfolio Analyst — run your strategies together and see which ones actually pull weight. Leave-One-Out shows the cost of cutting each system. The Diversificator shows where adding more stops helping.
Trading Ideas — every strategy I’ve published, with the EasyLanguage code and TradeStation workspace and a Plain English version ready to download and test on your own data.
Acces it here:
Back to the report…
Bonds
The 10-Year T-Note is the clearest position on the board right now.
The large, slow-moving institutions (pension funds, mutual funds, the group I call real money) added to their 10-Year position again this week. They are now holding close to their largest position of the past three years. And this is the second week in a row.
What’s interesting is that the bond price has not gone up. It fell on the week. So the buying is happening before the price has moved, not after.
That’s worth noticing, but it doesn’t tell you what happens next.
It tells you a patient group of buyers is building a position while the price is still weak.
Sometimes they’re early. Sometimes they’re wrong.
We’ll watch whether the price starts to follow.
The 5-Year shows the same buyers. The 2-Year does not. So the interest is in the middle of the curve, not the short end.
Equities
The S&P 500 and the Dow held up. Mid-caps held up too — big institutions actually added to them this week.
Small caps (the Russell 2000) are the exception. Real money has stayed away from small caps for months, and that didn’t change.
The move worth flagging is in the Nasdaq.
For weeks, hedge funds had been almost entirely out of the Nasdaq rally.
This week they bought back in heavily after most of the gains had already happened.
When the fast money shows up late to a move that’s already run, it’s worth keeping an eye on what they do next.
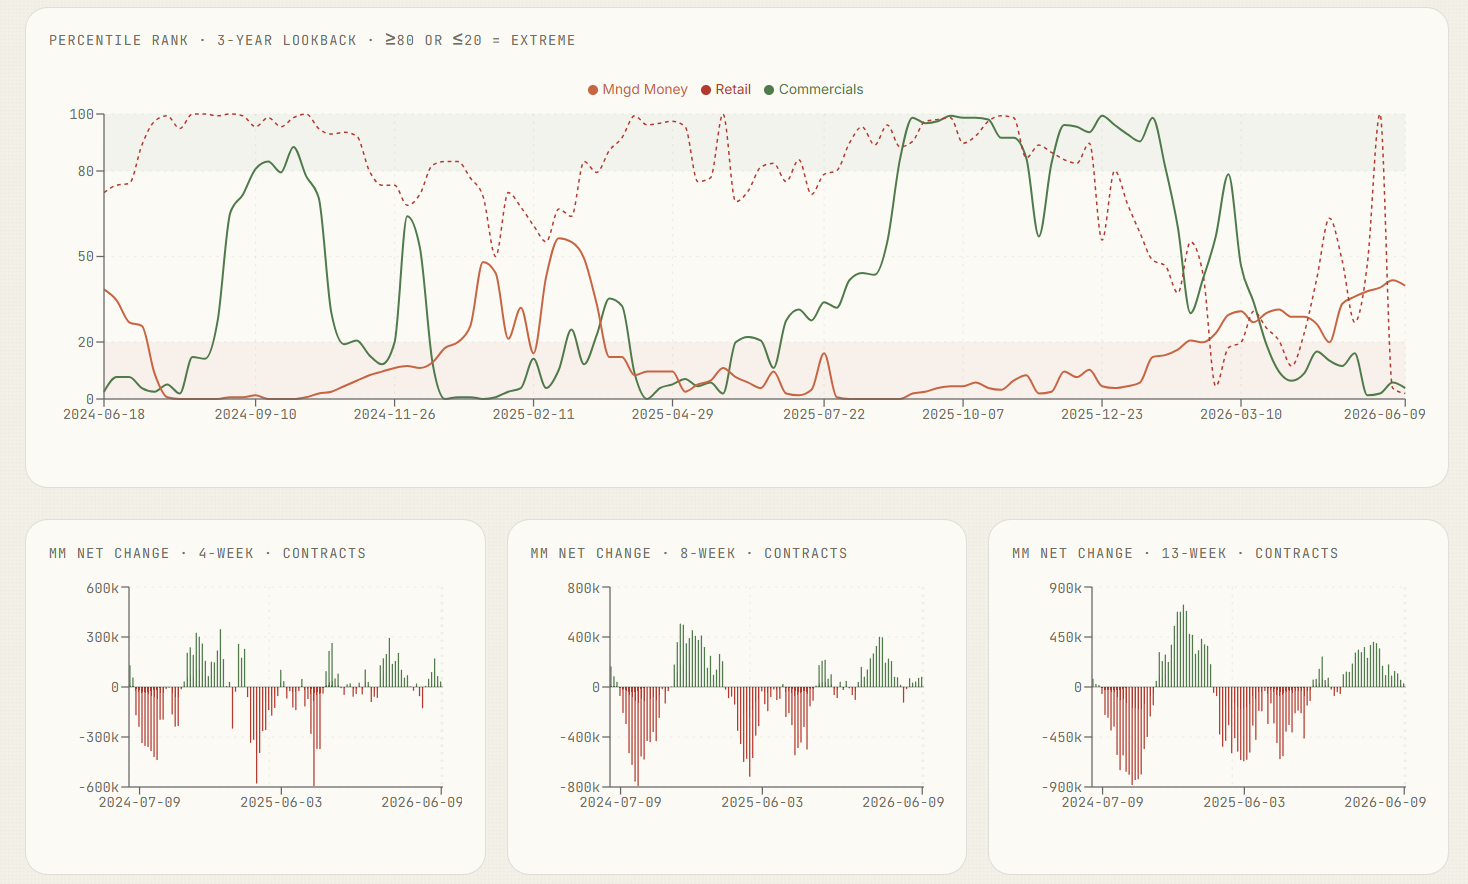
Energy
Energy was the worst-hit part of the commodity board.
Gasoline and heating oil fell harder than crude oil itself, which usually points to refining margins shrinking rather than a pure oil-demand story.
One thing stands out against the drop: the commercial traders in crude — the oil companies and physical-market participants — are still holding large long positions.
They didn’t sell into the decline.
That doesn’t mean crude has bottomed. It means the people closest to the physical barrel haven’t changed their minds yet.
Metals
Gold, silver, and platinum all fell. Silver and platinum the hardest.
The pattern here is the same as in bonds: the commercial traders are still positioned long even as the price dropped.
So you have weak price and steady commercial positioning at the same time. Those two things disagree right now. One of them gives.
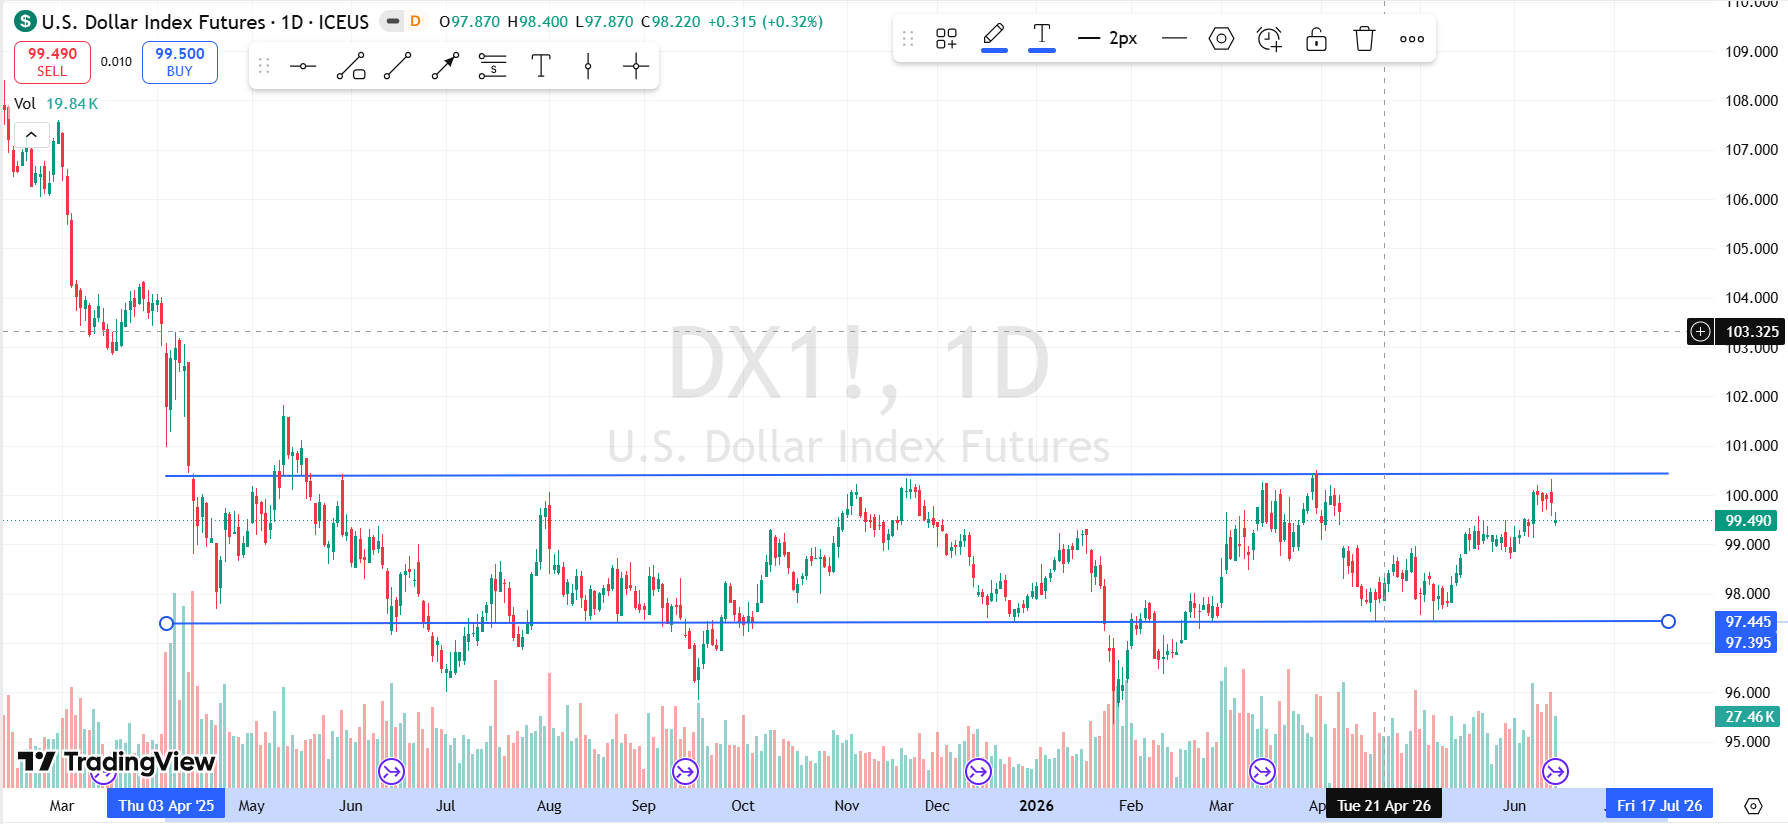
What likely settles it is the US Dollar, which rose again this week.
A stronger dollar usually pushes metals down. If the dollar stalls, the metals have more room to recover.
Soybeans
This was the most unusual single move of the week, and it needs a bit of background.
There’s a group in the report called swap dealers, mostly bank trading desks.
They don’t trade for themselves. They take positions to offset the hedges their clients ask for.
In grains, those clients are food companies: processors, large buyers, grain handlers.
This week, the bank desks went from a small long position in soybeans to a very large one, in a single week. It was one of the biggest one-week jumps I’ve seen in this contract and it happened while soybean prices were falling.
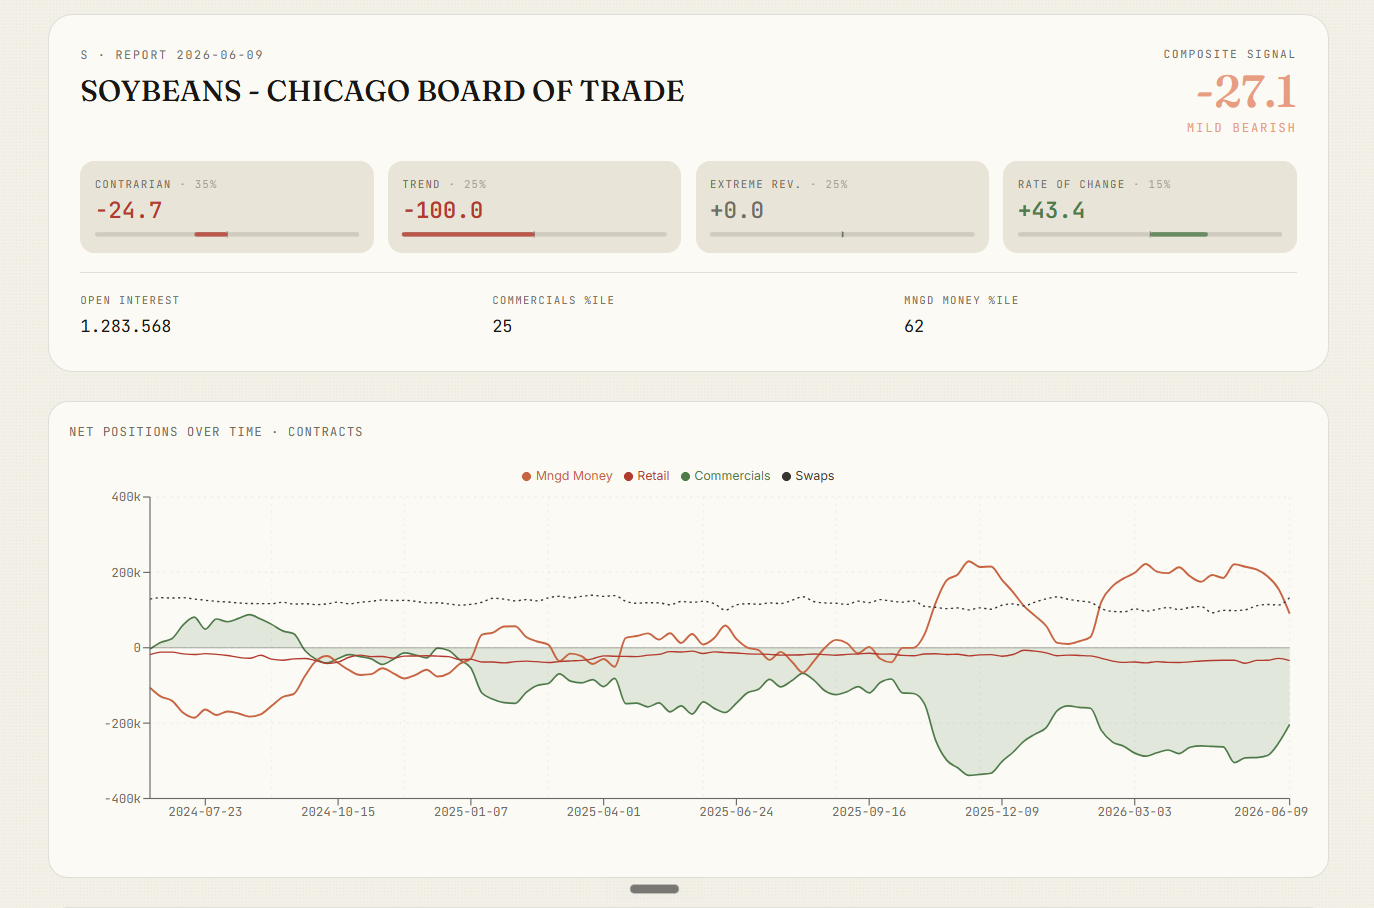
The straightforward way to read that: food companies are using the lower prices to lock in supply.
They’re buying weakness, not selling it. It doesn’t mean soybeans bounce tomorrow. But the people who hedge for the grain industry don’t usually build a position that size at the start of a longer decline. Let’s see…
Bitcoin
Bitcoin had the worst four weeks on the board: down 20%, and down about 25% from its early-May high.
The thing to note is who wasn’t there…
The big institutions have held essentially no position in Bitcoin futures this entire decline. Week after week, while the price fell.
That absence is itself a piece of information.
It’s not that they don’t understand crypto. It’s that they’re not set up to hold something they can’t value with confidence, especially with other people’s retirement money.
When the patient money stays out and the price keeps falling, there’s no large, slow buyer underneath to cushion it.
Currencies
The Dollar held its gains, and real money is still positioned long it. That fits with the metals weakness.
The Yen is the one to watch.
It’s sitting near the bottom of its three-year range, and both the slow money and the fast money are positioned very light.
When almost everyone has already sold a currency that’s already low, there isn’t much selling left to do.
These setups can stay quiet for a long time, then move quickly when they move. No signal yet, just a setup worth tracking.
Putting It Together
Here’s the picture as a whole.
A broad group of commodities sold off at once.
Across most of them, the commercial traders (the ones closest to the physical product) did not sell.
Big institutions stayed long bonds and large-cap stocks and added to both.
Hedge funds chased the Nasdaq late.
And in Bitcoin, the largest investors were simply absent the whole way down.
None of this is a prediction. It’s a set of positions.
The useful question for each market is the same one the dashboard is built to answer:
Is the price agreeing with how the big players are positioned, or disagreeing?
Right now, in bonds, metals, and soybeans, the price and the positioning disagree.
Those are the ones worth watching closely over the next few weeks.
Let’s see….

Talk soon,
— Leo
The Rogue Quant
Data: CFTC Commitments of Traders, through June 9, 2026. Price action through Friday close, June 12.
DISCLAIMER: This information is provided for educational and informational purposes only. It is not financial advice, nor a recommendation to buy or sell any securities or financial instruments. Trading involves substantial risk and is not suitable for every investor. You are solely responsible for your own investment decisions and should seek advice from a licensed financial advisor before acting on any information provided in this article. The author(s) and publisher disclaim all liability for any loss or damage arising directly or indirectly from the use of this information. Use this information at your own risk.