
Bitcoin's October Seasonality Exposed: a 90% Win Rate Pattern. Edge or Luck?
I Analyzed 10 Years of Bitcoin Data to Find Out if Seasonality Patterns Are Real

Two days ago, I read this:

Which is quite funny, because I’d been analyzing the seasonality effect in several commodities but hadn’t thought about cryptos…
Is there seasonality in cryptocurrencies, especially Bitcoin?
What Every Trader Gets Wrong About Seasonality Analysis
Every trader knows the classics…
“Sell in May and go away.”
“Natural gas rallies in winter.”
“Gold shines in September.”

But here’s what nobody talks about: most seasonal analysis is hopelessly incomplete.
Traders study one timeframe and call it research.
They’ll look at monthly patterns and ignore weekly execution.
Or they’ll focus on daily moves without understanding the underlying monthly structure.

So I developed a systematic framework for dissecting commodity seasonality across all timeframes.
Then I tried it on crypto…
Not to prove any particular theory, but to answer fundamental questions…
And that’s exactly what we’re going to tackle in today’s article:
The Statistical Reality: Does seasonal behavior actually exist in Bitcoin?
The Timeframe Breakdown: What happens when you zoom into October’s weekly and daily patterns
The Practical Framework: How to turn statistically proven patterns into systematic trading ideas
I tested this framework on 10 years of Bitcoin data, analyzing everything from annual cycles to weekday session patterns.
After reading that September “curse” headline, I decided to do what most crypto analysts never bother with:
Actual statistical testing.
Let’s dive in…
Building the Seasonal Foundation
Everyone talks about seasonality but does something like this actually exist in crypto, especially Bitcoin?
I started with a pretty basic analysis.
I grabbed the last 10 years of Bitcoin data and plotted it on a chart...
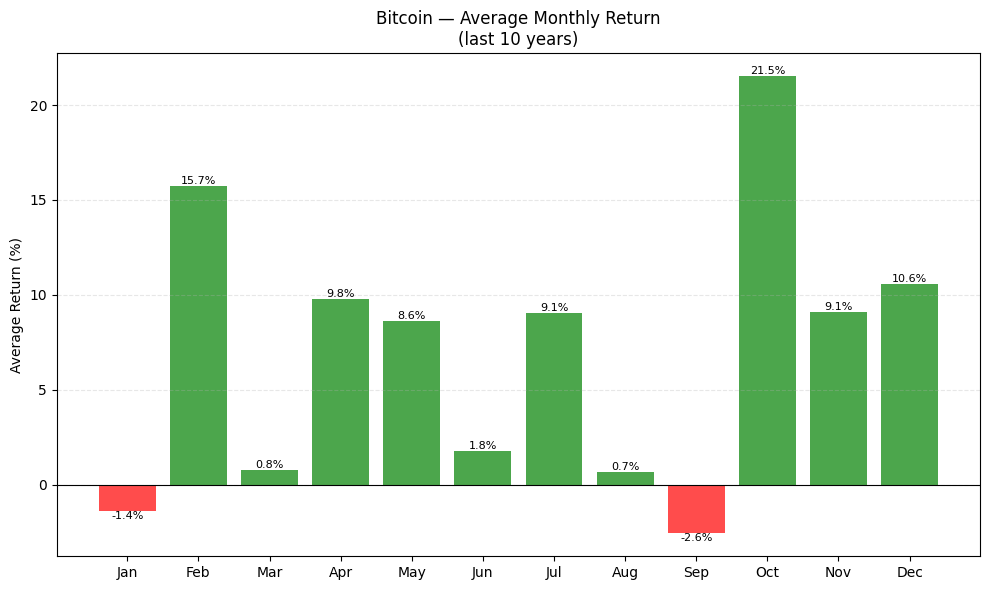
Pretty cool, right?
Over the last 10 years, only January and September had negative returns.
And October has been the best month of these last 10 years (consider this article as my gift to you).
But what if we wanted to know how many of all the observed October months were positive and how many were negative?
In other words:
What’s October’s win rate?
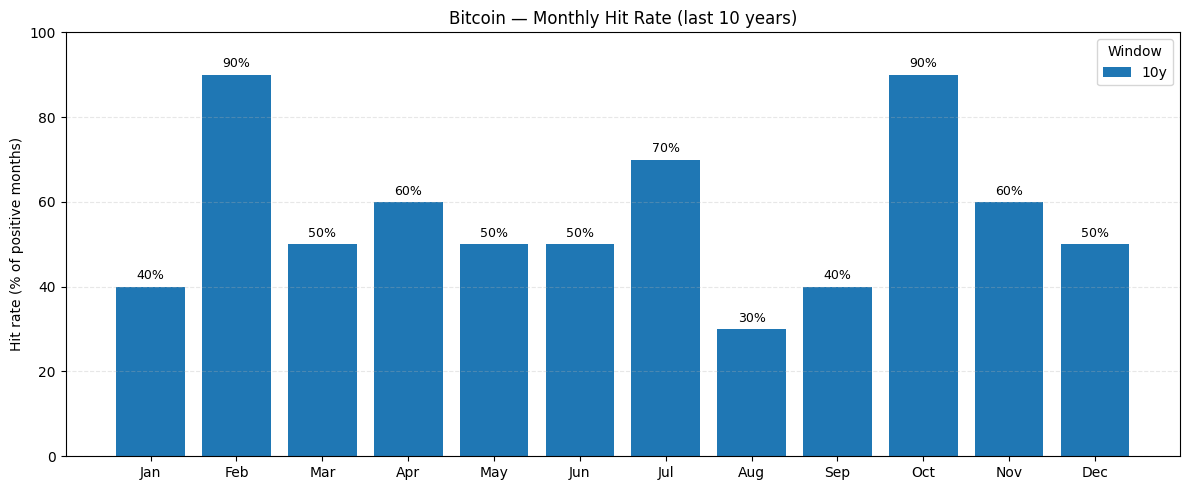
Not bad…
An 90% success rate is impressive.

What This Means in Practice
Knowing October is the best month is cool.
But for trading, you need more granularity.
Because even if October does +21% on average, it doesn’t go up 21% on day 1 and stay flat for the rest of the month.
How does this return develop over the weeks?
That’s where things get interesting...
The October Weekly Breakdown
I broke down each October into weekly chunks to see where that 21.5% actually comes from.
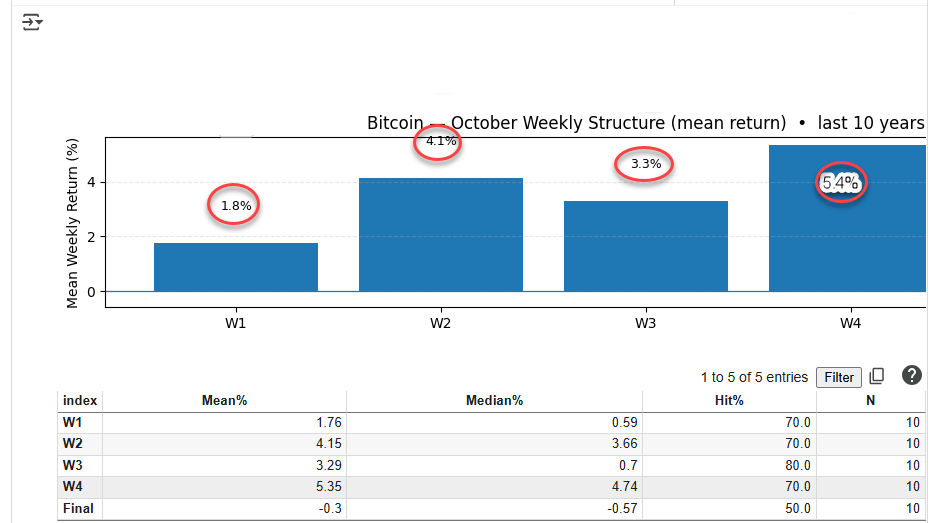
Here’s what jumped out:
Week 4 is the money week.
Week 1: +1.8% average (70% hit rate)
Week 2: +4.1% average (70% hit rate)
Week 3: +3.3% average (80% hit rate)
Week 4: +5.4% average (70% hit rate)
Final days: -0.3% average (50% hit rate)
Week 4 delivers 25% of October’s total performance in just 7 days.
But here’s the interesting part - Week 3 has the highest hit rate at 80%, even though Week 4 has the biggest average move.
Translation: Week 3 is more consistent, Week 4 is more explosive.

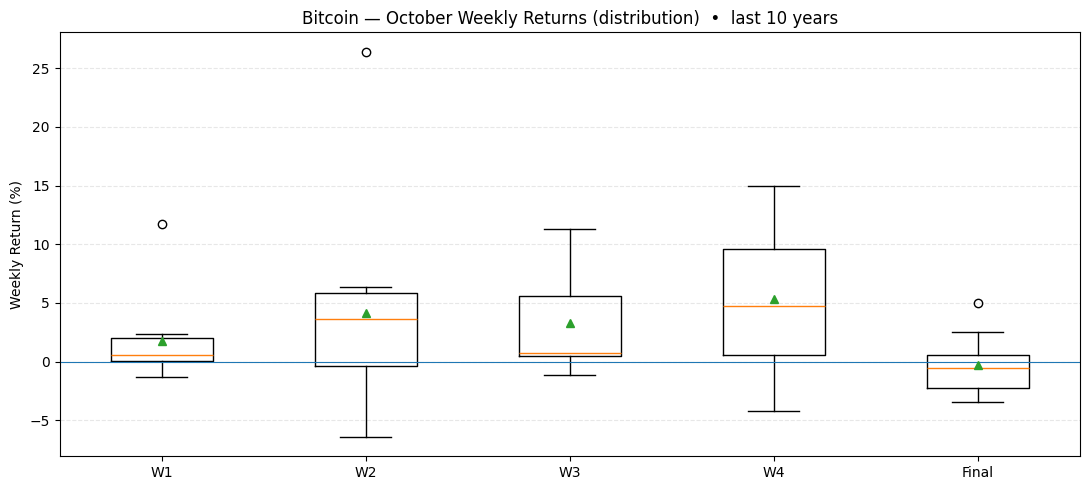
The End-of-Month Reality Check
Notice that “Final” period?
Those last few days of October are actually negative on average.
This makes sense when you think about it.
By late October, everyone who wanted to play the “Uptober” theme has already bought.
Smart money starts taking profits. Month-end rebalancing kicks in.
Looking at the distribution chart, you can see Week 4 has the widest range - it’s either explosive upside or notable downside.
Week 3 is much more consistent around that positive mean.
So now the question becomes:
Can we get even more granular?
What about day-of-week effects within these power weeks?

The Weekend Effect Nobody Talks About
This is where things get weird.
I analyzed Bitcoin’s day-of-week performance specifically within October and compared it to the all-time pattern.
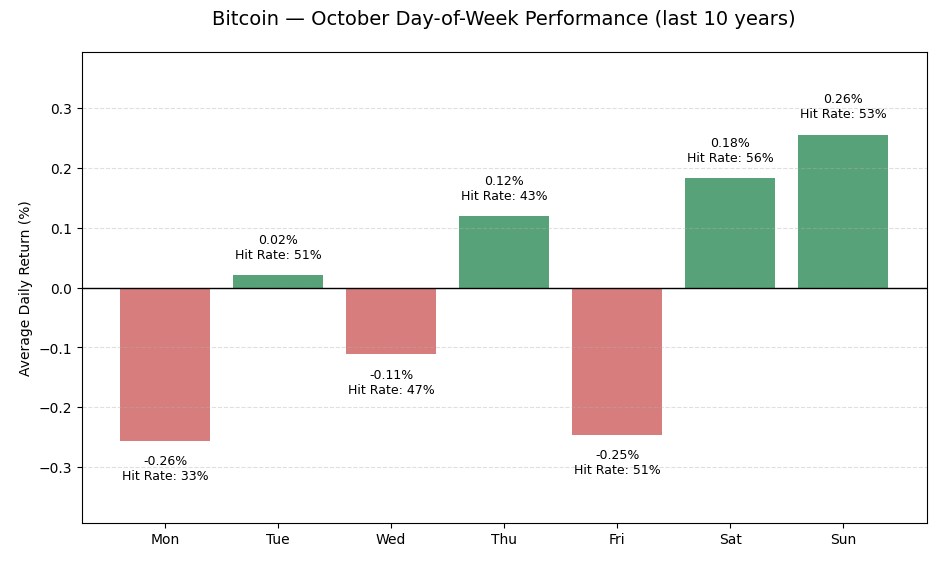
Look at this:
October’s best days:
Sunday: +0.26% (53% hit rate)
Saturday: +0.18% (56% hit rate)
Thursday: +0.12% (43% hit rate)
October’s worst days:
Monday: -0.26% (33% hit rate)
Friday: -0.25% (51% hit rate)
Now compare this to Bitcoin’s all-time day-of-week pattern:
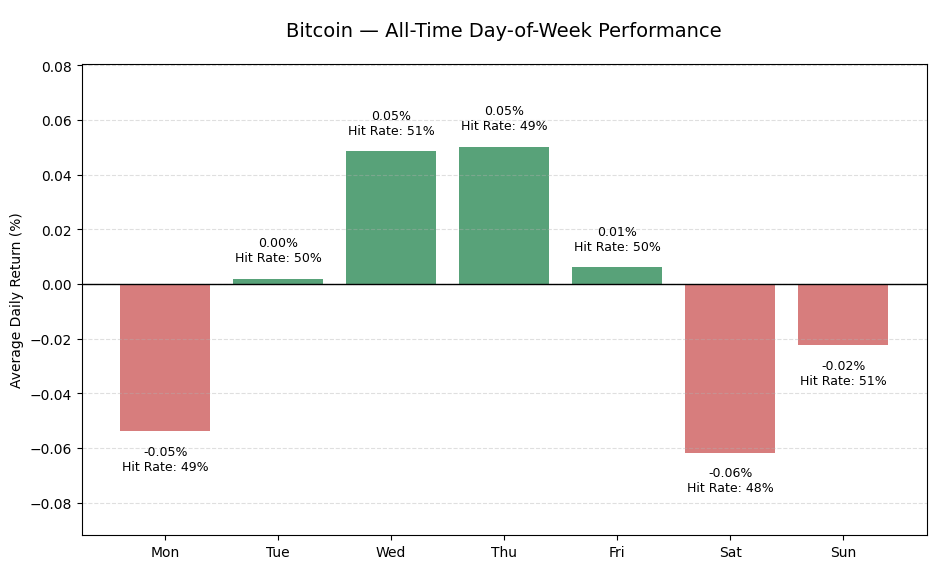
All-time best days:
Wednesday: +0.05% (51% hit rate)
Thursday: +0.05% (49% hit rate)
All-time worst days:
Saturday: -0.06% (48% hit rate)
Sunday: -0.02% (51% hit rate)
October completely flips the script.
Weekends, which are typically Bitcoin’s worst performing days, become the power days in October.
Meanwhile, mid-week days that usually perform well become mediocre.
But…

The Reality Check We Need
Hold on a second.
We’ve been diving deep into these patterns - October’s 90% win rate, Week 4 outperformance, weekend effects - but there’s a fundamental question we need to ask:
Is any of this actually statistically significant?
Think about it.

We’re looking at 10 years of October data.
That’s 10 data points for our monthly analysis.
For the weekly breakdown, we’re talking about maybe 40-50 weekly observations across all Octobers.
And for the day-of-week stuff?
We might have 200-300 individual days across all October periods.

Sample sizes matter.
With small sample sizes, you can find patterns in random noise.
You can cherry-pick timeframes that support any narrative you want.
Just because October has been positive 9 out of 10 times doesn’t automatically mean there’s a genuine seasonal effect.
Maybe it’s just luck. Maybe it’s coincidence.

To figure out if these patterns are real or just data mining artifacts, we’d need to run proper statistical tests:
Chi-square tests for the win rates
T-tests for the average returns
Bootstrap confidence intervals for the sample means
Multiple testing corrections since we’re looking at so many variables
That’s the next step.
Before anyone starts trading strategies based on “Uptober” or “Week 4 effects,” we need to know if these patterns would hold up to rigorous statistical scrutiny.
The data looks interesting…
But interesting isn’t the same as statistically significant.

The Statistical Verdict: What the Numbers Actually Tell Us
Time to find out if October’s “edge” is real or just a statistical mirage.
I ran the full battery of tests on our 10 years of October data.
Chi-square tests, t-tests, bootstrap confidence intervals, multiple testing corrections… the whole nine yards.
Here’s what survived the statistical gauntlet…
